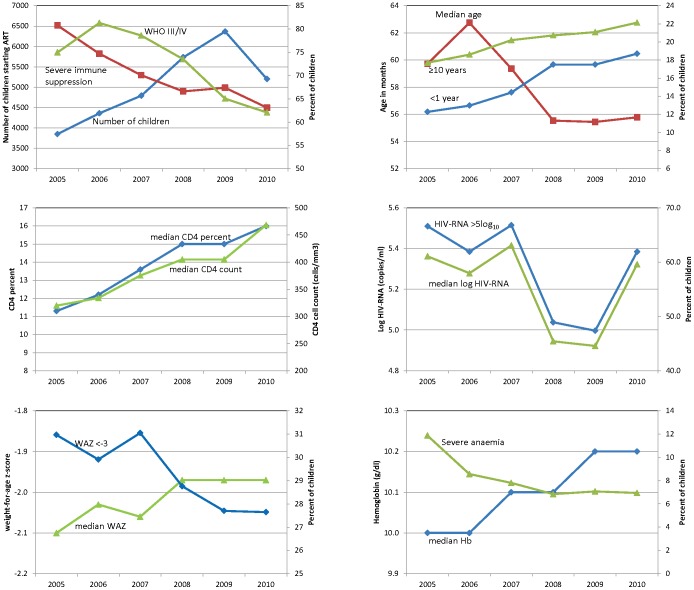
Figure 3. Characteristics of children at ART start by program year.
Characteristics of children at ART start by program year summarized as medians for continuous variables and proportions for categorical variables. p<0.001 for changes over program year for all variables (Cuzick's test for trend for continuous variables and logistic regression for categorical variables). (Note: Only children <10 years of age included in weight-for-age z-score graphs and only South African sites included for graphs of HIV-RNA.)

