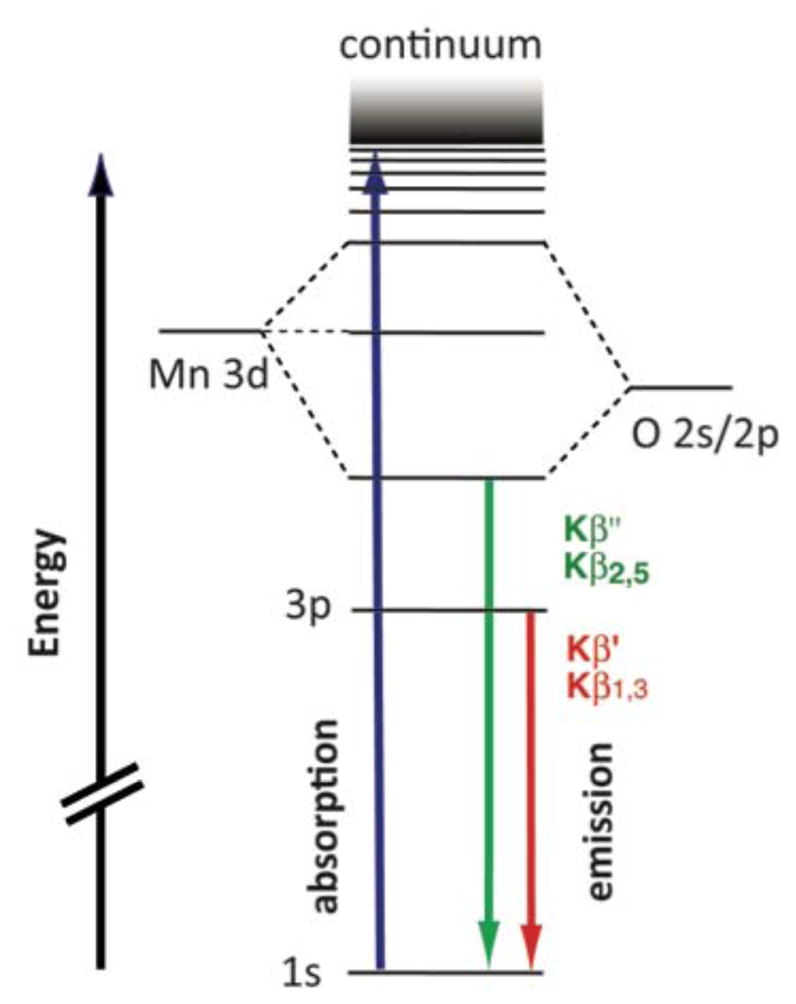
Figure 1.

Energy diagram representing the X-ray absorption and emission phenomena at the K-edge of Mn. Blue arrow: absorption of a photon, exciting a 1s-electron into the continuum, leaving a 1s-hole. Green arrow: relaxation of ligand 2s/2p electron into the 1s-hole, emitting a photon in the Kβ ″ or Kβ2,5 energy range. Red arrow: relaxation of a metal 3p electron into the 1s-hole, emitting a photon in the Kβ′ or Kβ1,3 energy range.
