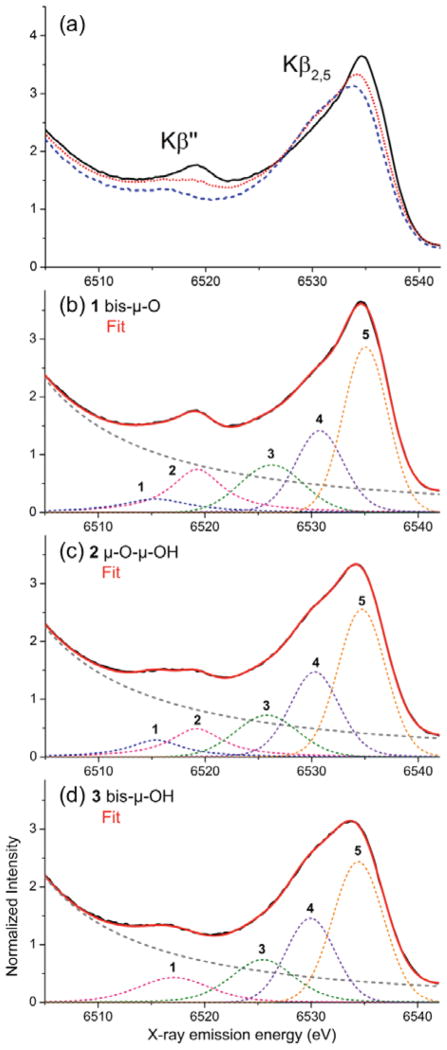
Figure 4.
(a) Valence-to-core region of the X-ray emission spectra of compounds 1 (solid black), 2 (dotted red), and 3 (dashed blue). (b)-(d) Fits to the spectra of compounds 1–3. The energies and areas of the fit components (peaks 1–5) are listed in Table 1. Second derivatives of the background-subtracted normalized data are given as Figure S2 in the SI.

