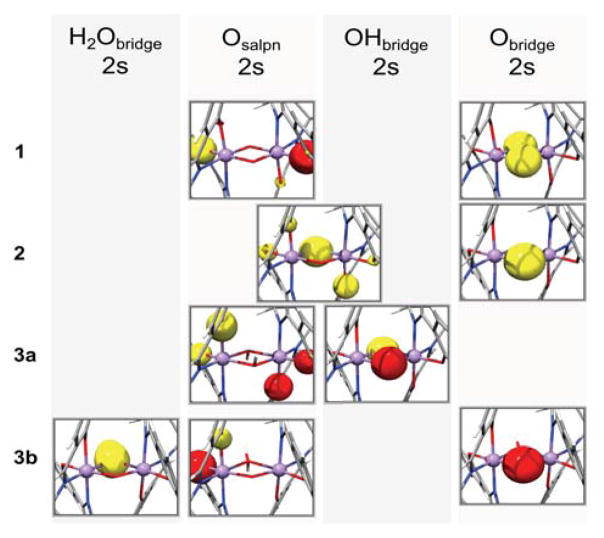
Figure 7.
Representative donor orbitals corresponding to each of the assigned regions of the Kβ″ peak in Figure 6 (except “Nsalpn2s”, instead “OHbridge2s” is shown in a separate panel); from top to bottom: bis-μ-oxo (1), μ-oxo-μ-hydroxo (2), bis-μ-hydroxo (3a), μ-oxo-μ-aquo (3b).

