
Figure 2.
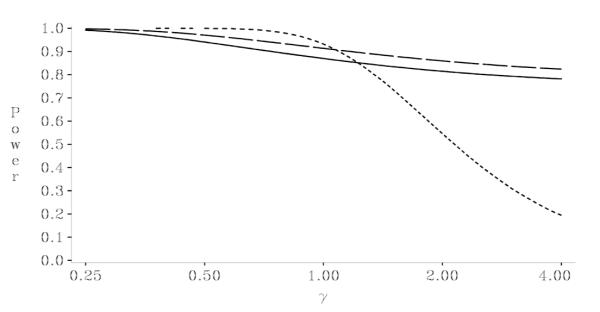
Plot of power as a function of for CLAHE example with αt = 0.0011, Pt = 0.90, θ* = 0.10, = 0.0065, n1 = 10, and n0 20, for: (a) Fixed sample design n0 = 20: dotted line; (b) IP unadjusted = with test with n+,min = 10 and n+,max = ∞: dashed line; (c) IP bounding test with n+,min = 10 and n+,max = ∞: solid line