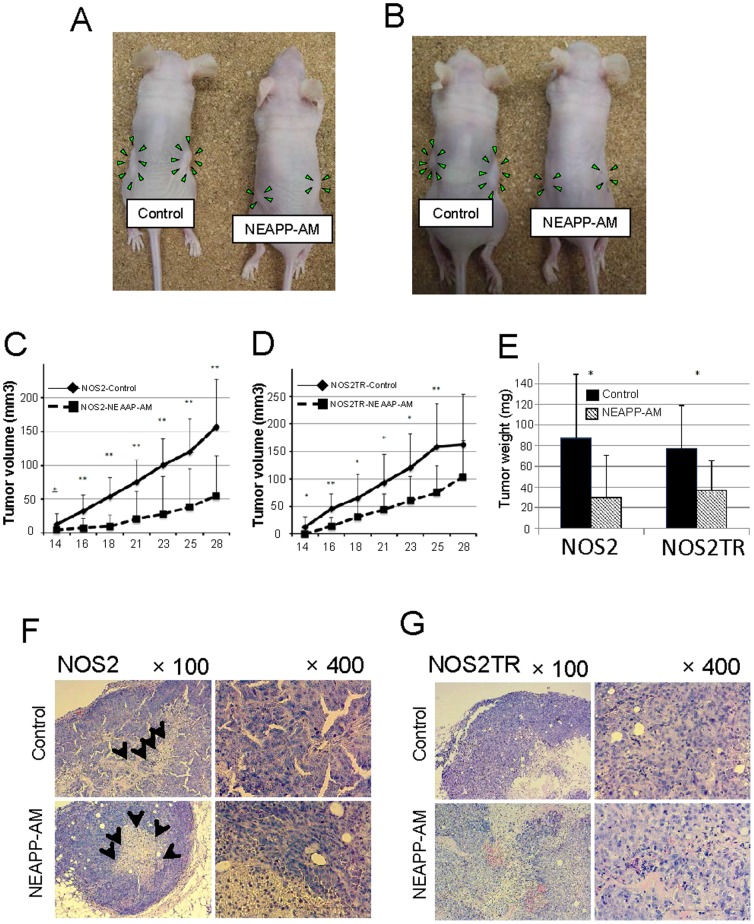
Figure 8. Anti-tumor effect of NEAPP-AM in mice with NOS2 and NOS2TR cell lines.
A, B: The macroscopic observation of nude mice bearing subcutaneous NOS2 (A) and NOS2TR (B) tumors on both flanks. Mice were injected with NOS2 and NOS2TR cells and then received medium alone or NEAPP-AM. A total of 0.4 mL of medium or NEAPP-AM was administered locally into both sides of mice three times a week. All mice were sacrificed at 29 days after implantation. Green arrowheads indicate tumor formation. C, D: Time-dependent changes in the tumor volume in xenografted models are shown, medium alone (♦) or NEAPP-AM (▪). Each point on the line graph represents the mean tumor volume (mm3) for each group on a particular day after implantation, and the bars represent SD. *P<0.05, **P<0.01 versus control. E: The bar graph shows the mean tumor weight of the excised NOS2 and NOS2TR tumors from NEAPP-AM or control groups. P-values versus the control group were 0.017 and 0.014 in the NOS2 and NOS2TR groups respectively. F, G: Histological analysis of tumors. Representative images of hematoxylin and eosin staining of paraffin-embedded tissue sections from xenografted tumors implanted in NOS2 (F) and NOS2TR (G). Black arrows indicate necrotic core within the tumor. The scale bar corresponds to 100 µm.

