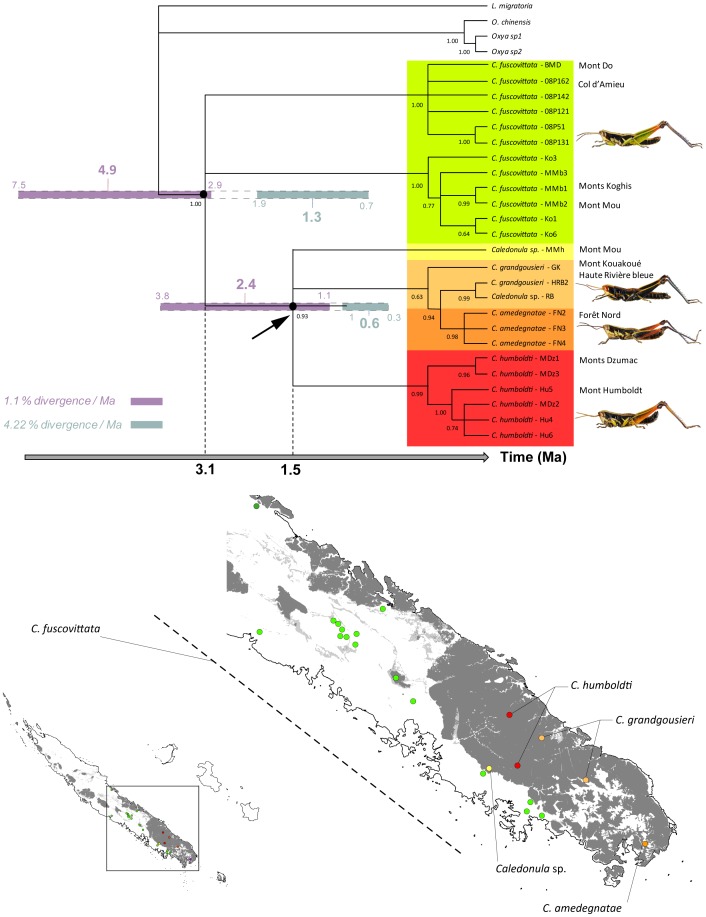
Figure 2. 50% majority-rule consensus tree for Caledonula obtained from Bayesian analysis of the combined data set (Cytb, CO2, EF1a and H3).
The Bayesian posterior probabilities are indicated below branches. The geographical distribution is given at the right of the taxon names. On the topology, pale blue lines represent the dating results obtained with the divergence rate of 4.22%/Ma, and violet lines represent the dating results obtained with the divergence rate of 1.1%/Ma. On the maps, the distribution of ultramafic rocks and corresponding metalliferous soils is indicated in grey, and the species distributions are indicated with the same colour as in the phylogeny.

