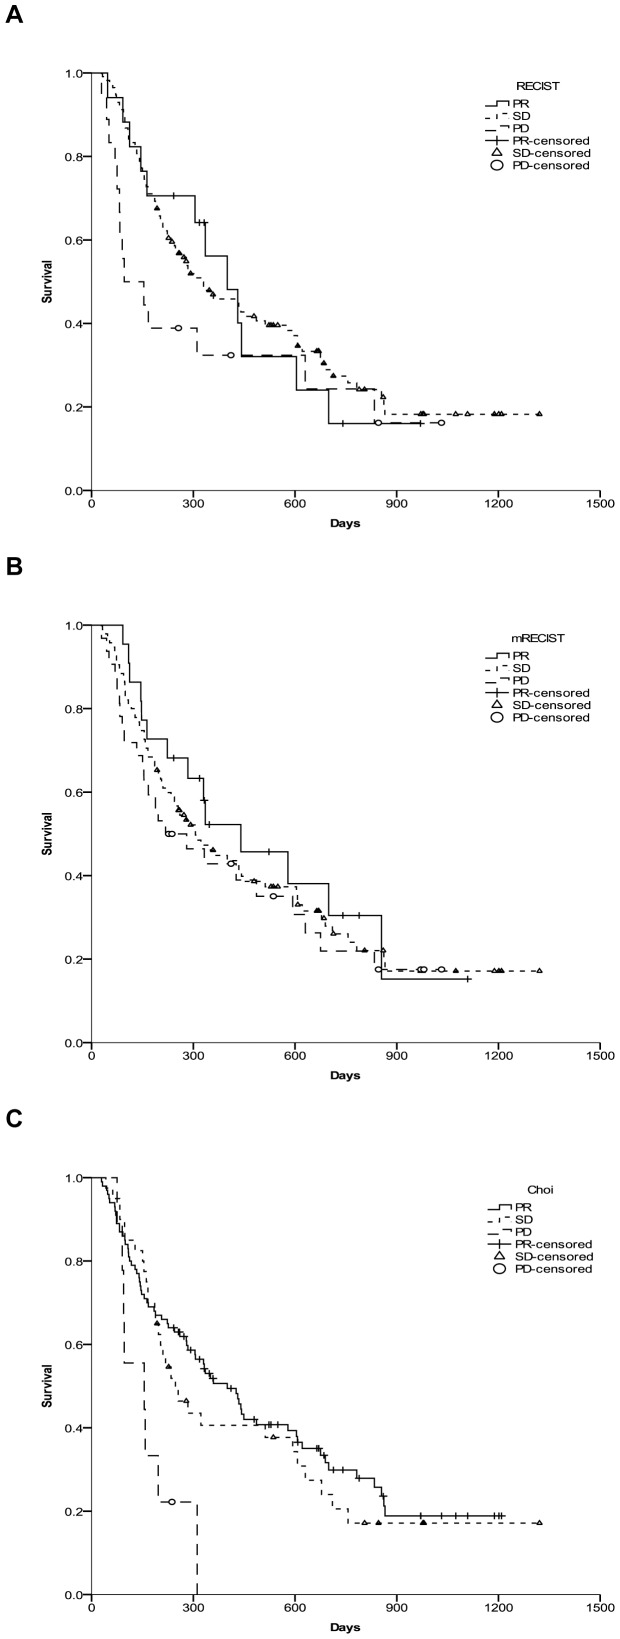
Figure 2. Kaplan–Meier curves were generated to compare survival between PR, SD, and PD according to three radiological assessment methods.
HCC patients undergoing SIRT had radiological responses, as evaluated by three criteria: (A) RECIST 1.1, (B) mRECIST, and (C) Choi, carried out at one month post-SIRT.

