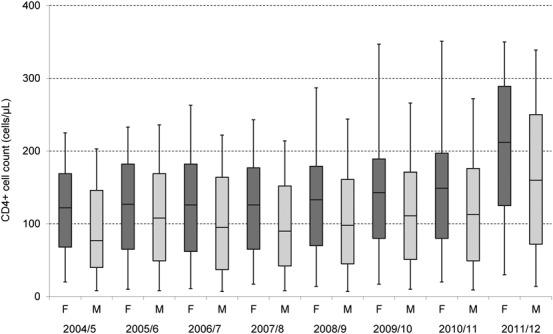
FIGURE 1.

CD4+ cell count at initiation of ART by time period and sex (nonpregnant females and males). Upper and lower margins of the box represent the 25th and 75th percentiles, respectively, with the horizontal line representing the median; whiskers represent fifth and 95th percentiles.
