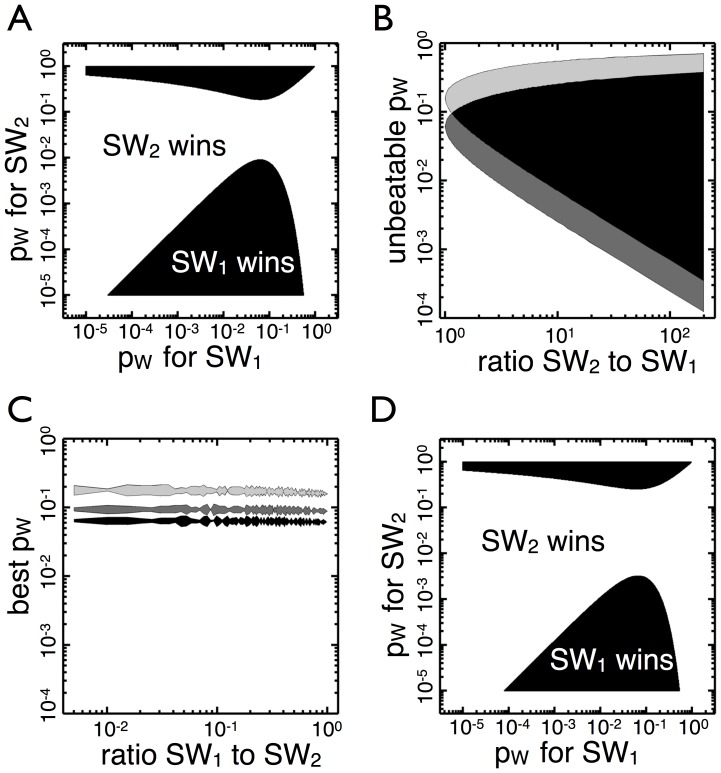
Figure 3. Competitions in which one organism has a numerical or growth advantage.
(A)  begins growth in
  with a 3: 1 advantage to
  (150: 50, growing to N =
  ). The black area corresponds to combinations of
  in which
  leaves more
  types than
  (white is the converse). The gap between the two areas corresponds to a range of transition probabilities in which
  maintains an advantage independent of the transition probability of
  . (B) The range of transition probabilities for which
  maintains an advantage is shown as a function of the initial numbers advantage. The light gray area corresponds to
  , the dark gray is
  , and black is the overlap. Increased carrying capacity (N) shifts the range of transition probabilities down but does not greatly alter the total area. (C) The transition probability
  that minimizes the losses for
  is shown as a function of its numerical disadvantage. The light gray is
  , the dark gray is
  , and the black is
  . There is a slight increase in the optimal transition probability as the disadvantage increases (left of the graph) but it is less than a tenth of an order of magnitude away from the optimal transition probability when the competition is fair. (D)
  has a growth advantage compared to
  , dividing 10% faster. The two begin with one organism and divide until
  . Again
  has a range of unbeatable transition probabilities, and the graph resembles A.

