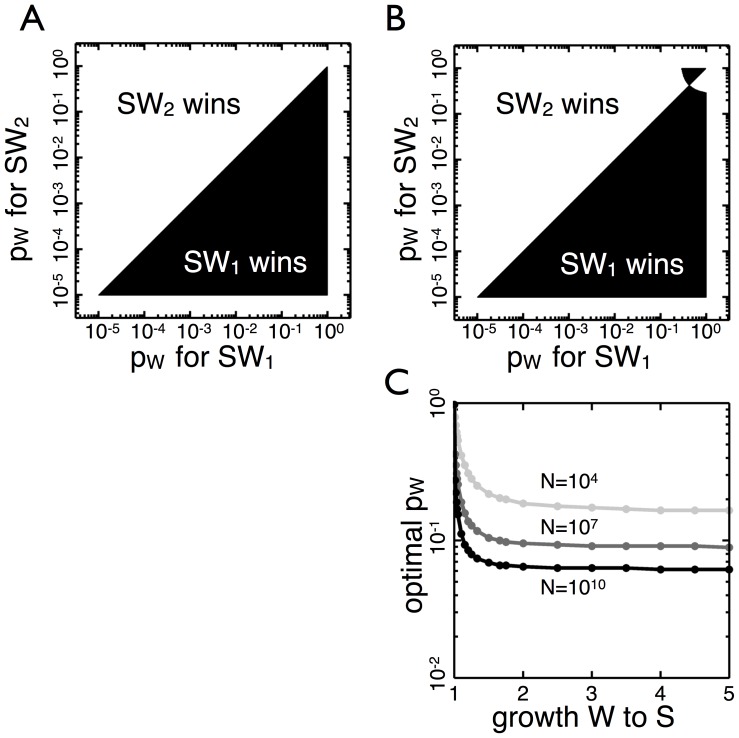
Figure 4. The effect of the maladapted type’s growth on the optimal transition probability.
(A) Two  organisms compete (
 ) with different transition probabilities,
  , when
  types grow at the same rate as
  types– when the cost of maladapted type (
 ) is minimal. Without a penalty for producing
  types the organism with the higher
  always wins. (B)
  types grow 1% slower than S types (
 ). The optimal transition probability decreases and the top black area of the transition probability competition graph increases. (C) The optimal
  is shown as a function of the growth discrepancy between S and W types for three different values of N. The optimal transition probability when W types grow by a factor of 1.5 times slower than S types is approximately the same as when the W types do not reproduce at all.

