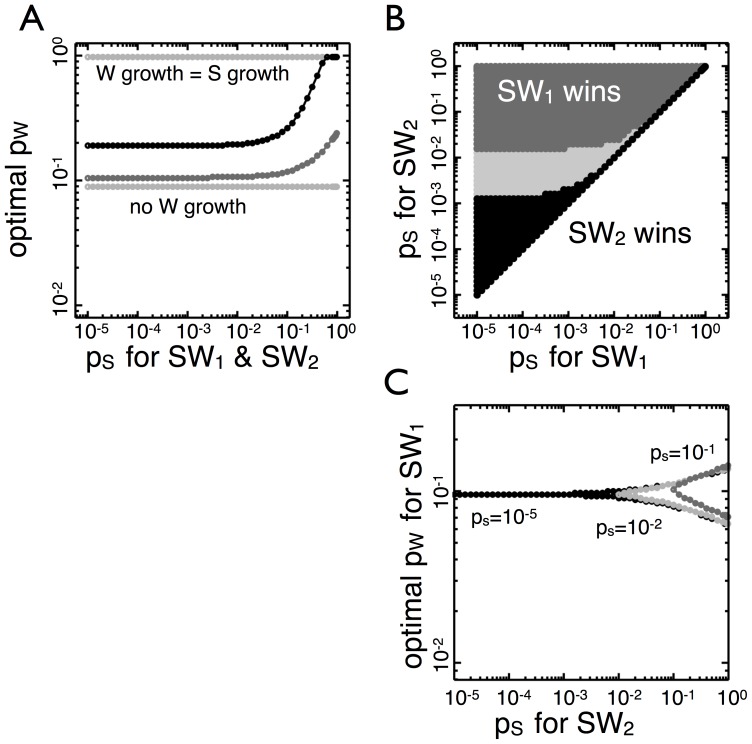
Figure 5. The effect of the probability  on the optimal transition probability.
(A) The optimal value of  is shown as a function of a fixed
  for both organisms. The light gray horizontal lines represent the trivial cases when W types never divide (bottom) or grow at the same rate as S types (top). When W grows 90% of the rate of S (black) or 66% of the rate of S (dark gray) the optimal
  does not change until
  , at which point it increases to counteract
  . (B) For competitions between SW organisms with different values of
  (
( ), the organism with the lower
  has an advantage and has a range of transition probabilities for which it does not lose in frequency. The shading color corresponds to the size of this range:
  (black),
  (light gray), and
  (dark gray). For larger differences in
  , there exist more transition probabilities
  that an organism can adopt to maintain or gain in frequency. (C) The optimal
  is shown as a function of the advantage in
  for competitions from B. The
  for
for  is fixed at either
  (black),
  (light gray), or
  (dark gray). The range of the optimal
  (area between curves of the same color) is narrow until the
  for
for  . Thus, the range depends on the magnitude of the advantage only when
  is sufficiently high.

