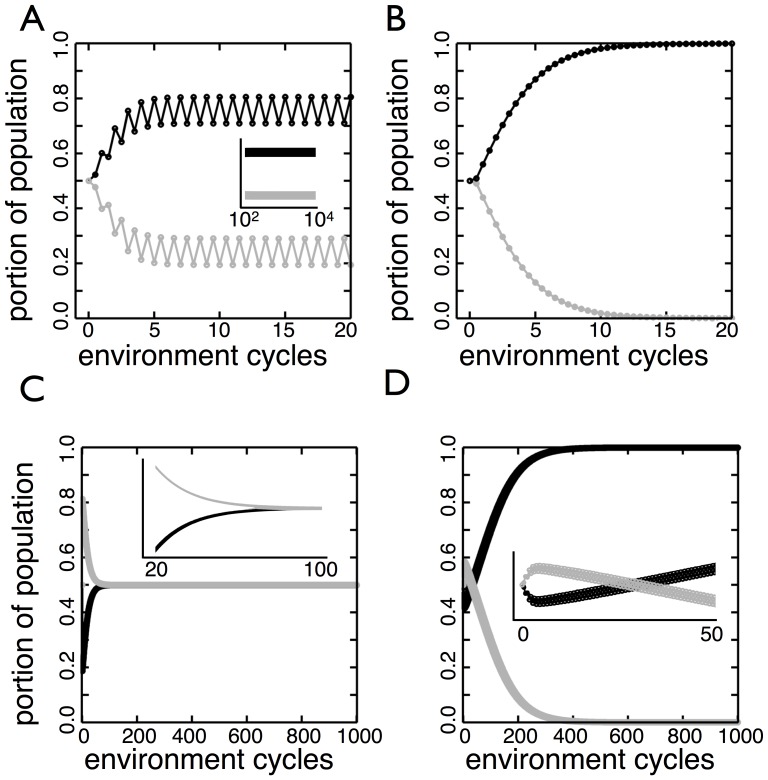
Figure 7. Different behaviors with an imperfect filter between environments.
(A) The populations of  (black) and
  (gray) form a stable oscillation as the environments cycle between
  and
and  . The transition probabilities are presented
  in the order of
 ,
, 
 ,
, 
 , and
, and 
 . For
. For  the transition probabilities are
  and for
  they are
  . (B)
. (B)  (black) drives
  (gray) extinct. For
  the transition probabilities are the optimal set using perfect filters
  and for
  they are
  . (C)
. (C)  (black) and
  (gray) monotonically approach the same frequency in the population. For
  the transition probabilities are
  and for
  they are the optimal set when perfect filters are used
  . (D)
. (D)  (black) decreases in frequency for five rounds before changing direction and driving
  (gray) extinct. The transition probabilities for
  are
are  and for
  they are
  .
.

