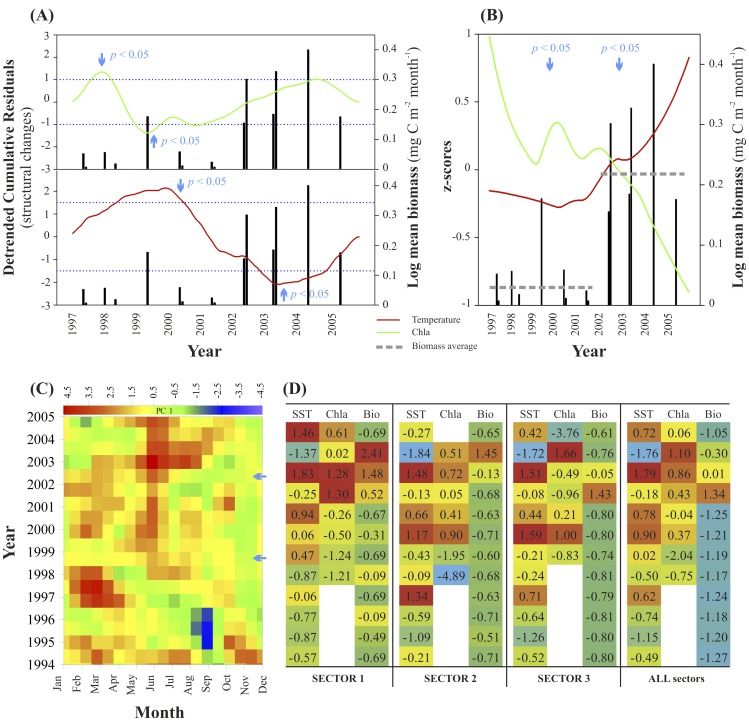
Figure 2. Summary of environmental and hydroclimate variables affecting the jelly-carbon depositions.
(A) Structural changes of the temperature and chlorophyll a (Chla) over the period of jelly-carbon transfer. Significant temporal changes occurred in environmental predictors, although they were more evident in temperature. Significant changes are reached when the predictors surpass the threshold limits (p<0.05). (B) Synthesis of environmental and biological changes with the identification of the timing of the change (along with the significance). The horizontal dashed lines represent average biomass values for the main periods before and after 2001 (significantly different, t-test, p<0.05). (C) Monthly hydroclimate first principal Component (PC1) individual values for the study period from 1994 to 2005. (D) Quartile analysis of the zscores of temperature, Chla and the normalized (per unit area) biomass from 1994 to 2005 separately for each sector and then for all sectors.

