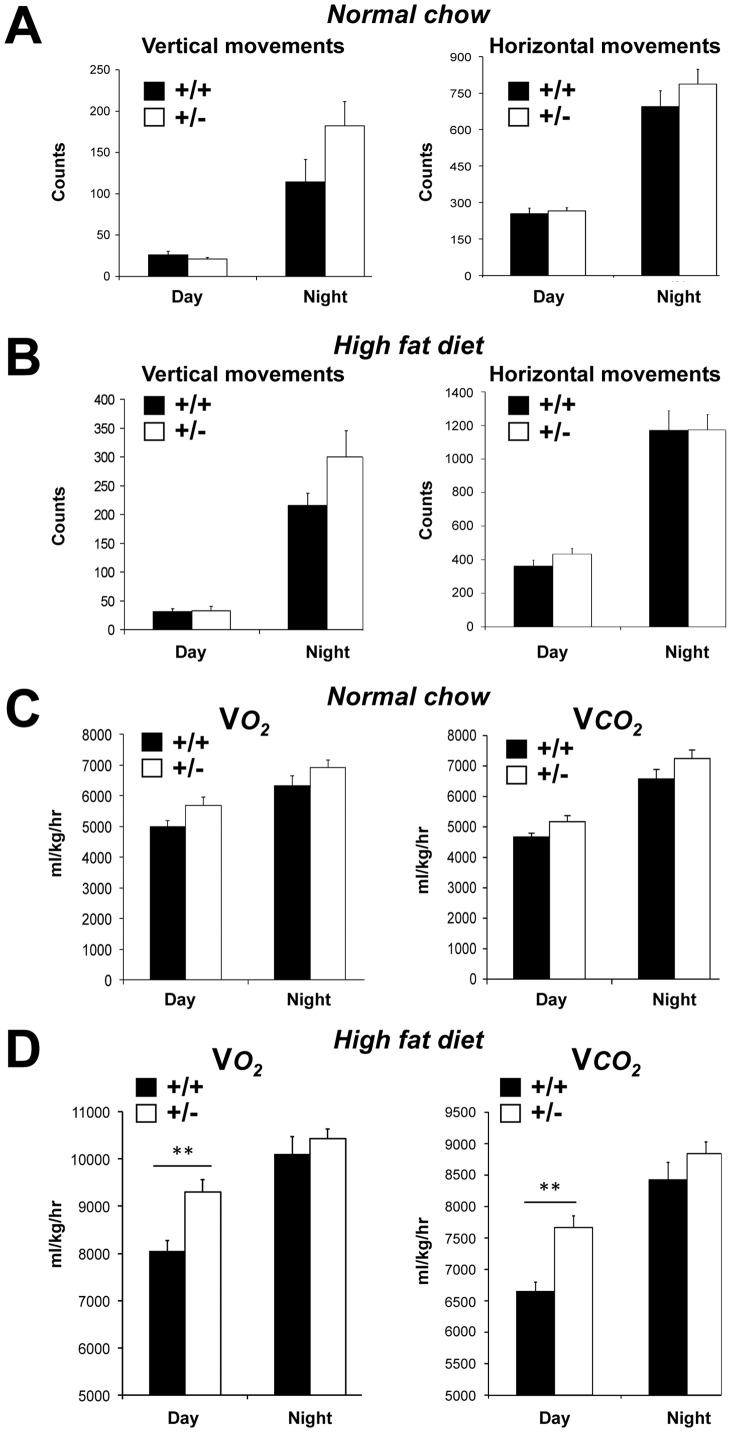
Figure 7. Locomotor activity and indirect calorimetry for MCT1 +/+ and MCT1 +/− mice fed a normal chow or high fat diet.
(A) Vertical and horizontal movements of MCT1 +/+ and MCT1 +/− mice under normal chow. (B) Vertical and horizontal movements of MCT1 +/+ and MCT1 +/− mice under high fat diet. Filled bars, MCT1 +/+ mice; open bars, MCT1 +/− mice. (C) O2 consumption and CO2 production of MCT1 +/+ and MCT1 +/− mice fed a normal chow. (D) O2 consumption and CO2 production of MCT1 +/+ and MCT1 +/− mice fed a high fat diet. VO2, oxygen consumption ; VCO2, carbon dioxide production. Filled bars, MCT1 +/+ mice; open bars, MCT1 +/− mice. Results represent mean ± SEM, n = 5-8. Asterisks represent a statistically significant difference between MCT1 +/+ and MCT1 +/− mice evaluated using a Student’s t-test. **P<0.01.

