
Figure 3. Results of the 2×2 ANOVA with condition (EAM/SAM) and group (YA/OA) as factors in the right hippocampus using region-of-interest analyses.
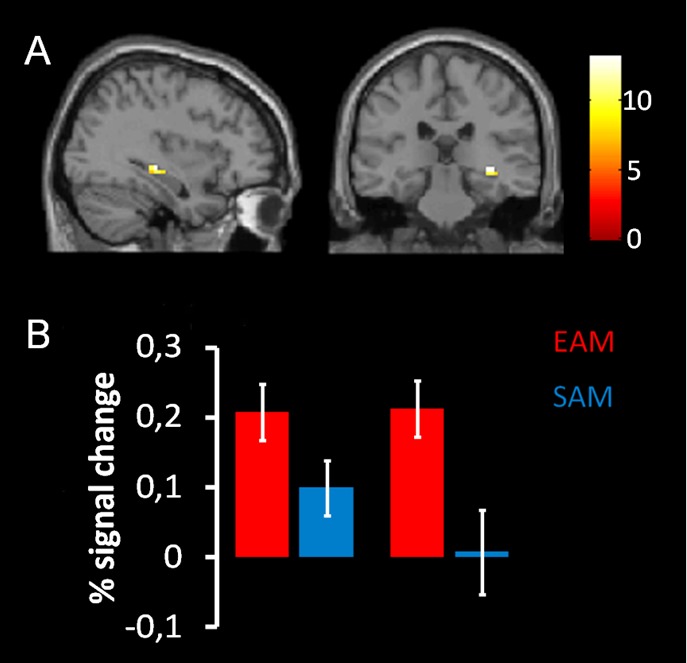
A) Main effect of condition showed in the sagittal and the coronal plane on the left and the right respectively. B) Plots represent percentage of signal change in right hippocampus (36 –27 –6) for each condition of interest, red bars represent EAM, blue bars represent SAM, and both groups, young and old group on the left and right respectively. Statistical maps are superimposed to an MNI T1 template.