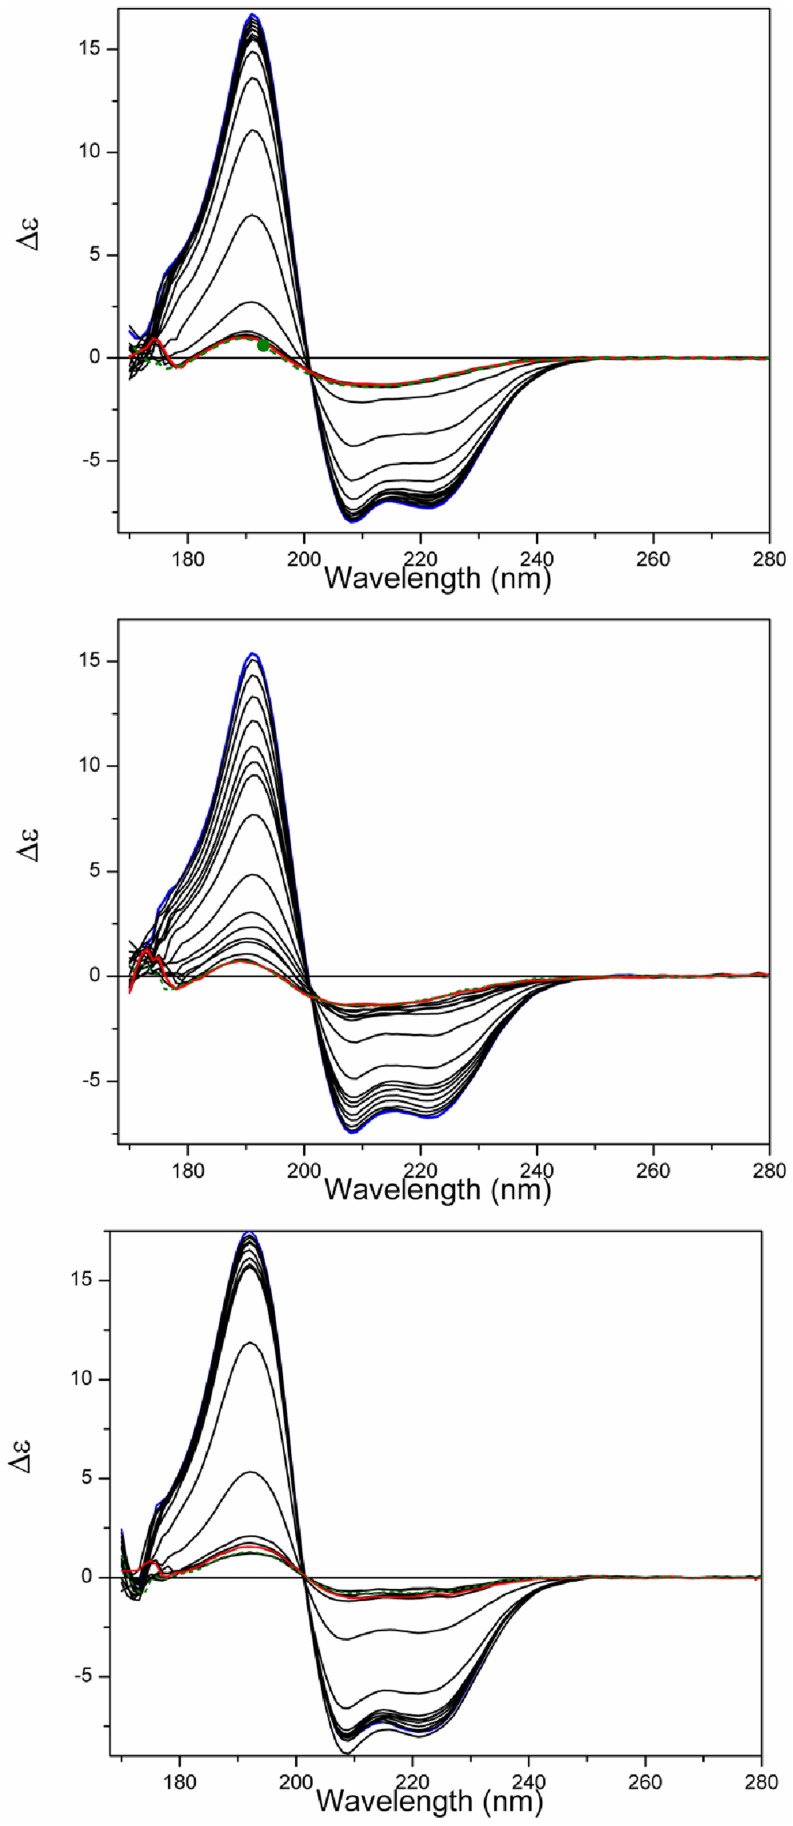
Figure 4. Thermal stability studies.
a) SRCD spectra of S100A12 in the absence of vesicles or b) in the presence of DPPC vesicles or c) in the presence of DPPG vesicles as a function of temperature. The temperature range was from 5°C (blue) to 85°C (red), in 5°C steps (intermediate curves in black). After the heating process, the sample was cooled to 25°C (dashed green).

