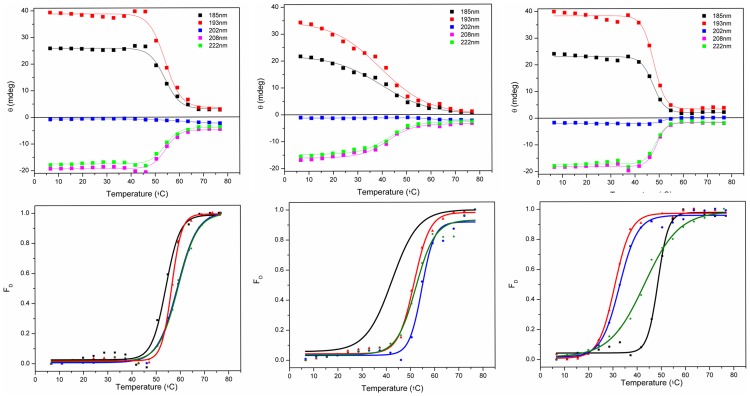
Figure 5. Curves monitoring the 185, 193, 202, 208 and 222) the absence of vesicles or in the presence of b) DPPC or c) DPPG vesicles.
Tm determination for S100A12 denaturation in d) the presence of the ions or e) in the presence of the ions and DPPC vesicles, and f) in the presence of the ions and DPPG vesicles. Transitions were monitored at 222 nm and expressed as fraction of protein denatured (FD), using a sigmoidal curve fit on Origin software.

