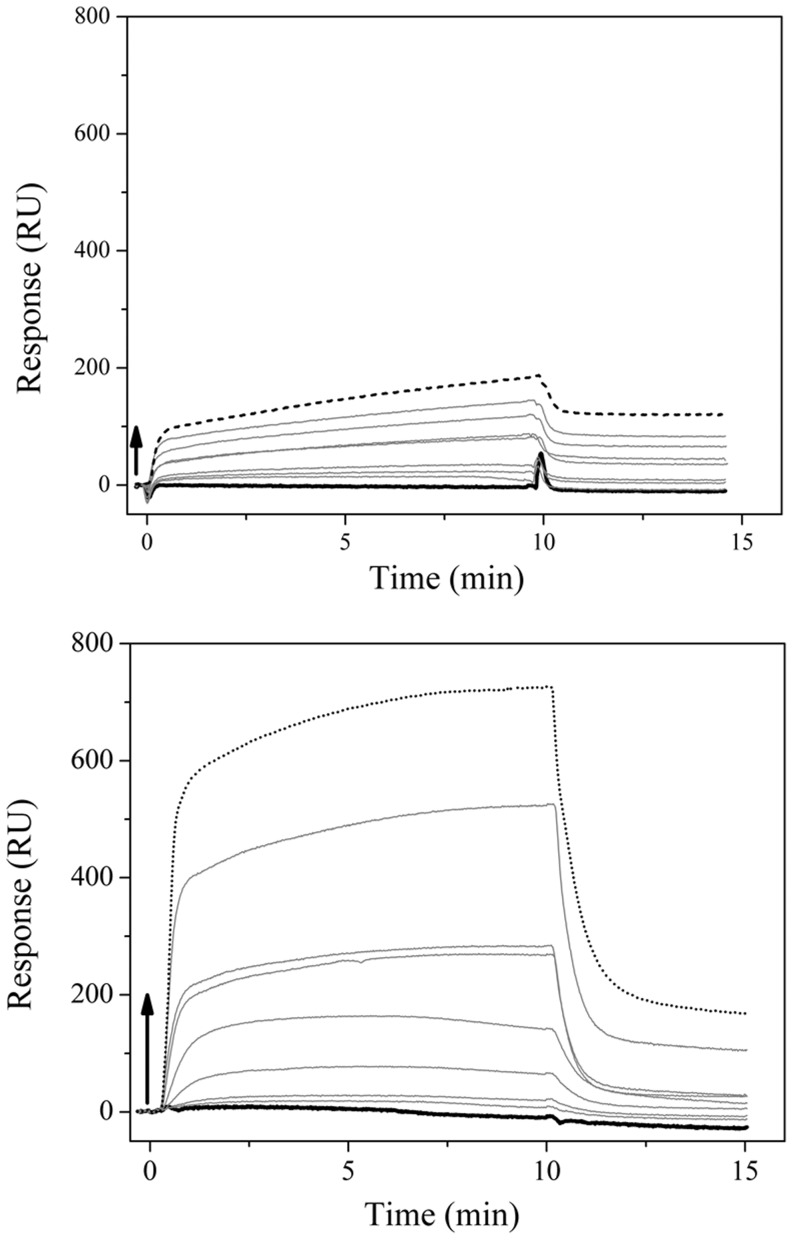
Figure 6. SPR sensorgrams of the porcine apoS100A12 adsorption onto a) DPPC and b) DPPG bilayers immobilized on a L1 sensorchip.
Injections of the protein were made at 0 µL/min flow rate, at 25°C, for 10 minutes, and running buffer was added to start the dissociation. Arrows indicate the points where the S100A12 concentrations were increased: 31 nM (bold), 62 nM, 125 nM, 250 nM, 0.5 µM, 1 µM, 2 µM, 4 µM, and 8 µM (dot).

