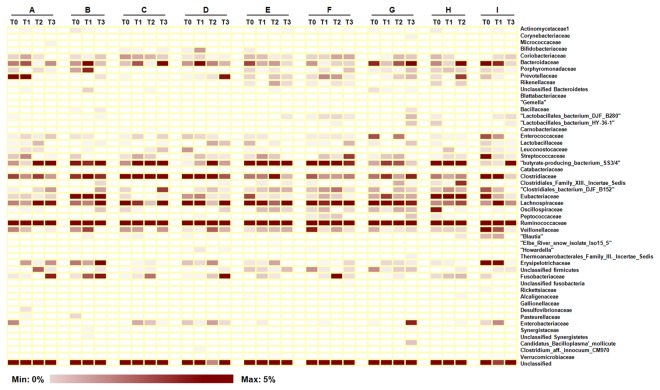
Figure 3. Changes of gut bacterial family level taxa in gynecological cancer patients through the radiotherapy.
Each column in the heatmap represents a sample from nine cancer patients. Three or four samples from the same individuals were grouped together in parallel. Each row represents a family level taxon. The color intensity of the panel is proportional to the abundance of certain taxon (max 5%). The family level taxon name is represented on the right side of heatmap.

