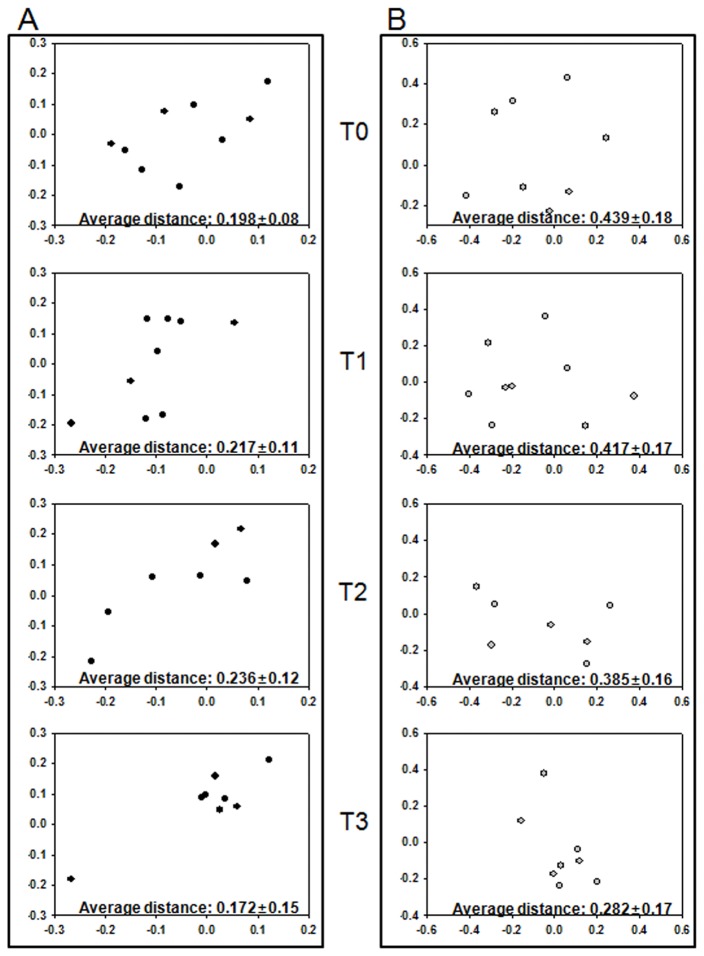
Figure 4. PCoA comparison of gut microbiota during radiation therapy.
Distances between all communities were clustered with the Jaccard (A) and thetayc coefficient (B) and visualized with PCoA plots. All plots in a stage (T0, T1, T2, and T3) are separately marked in the different graphs to represent the change of similarity between communities in a stage. Average distances (± SD) between all plots are represented at the lower part of each graph.

