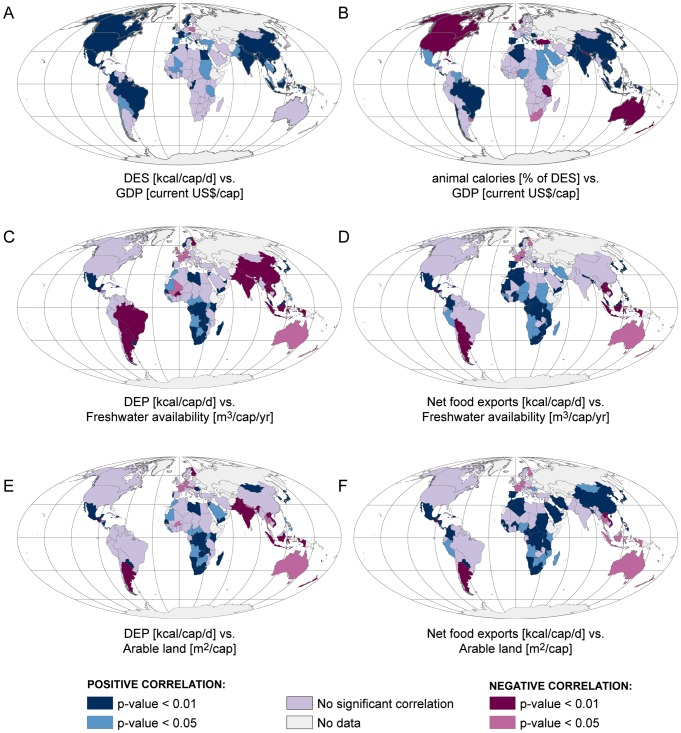
Figure 6. Results of correlation analyses mapped.
A: GDP (gross domestic product) and DES (dietary energy supply); B: GDP and supply of animal based calories; C: freshwater availability and DEP (dietary energy production); D: freshwater availability and net food exports; E: arable land and DEP and F: arable land and net food exports. See Table 1 for tabulated population results.

