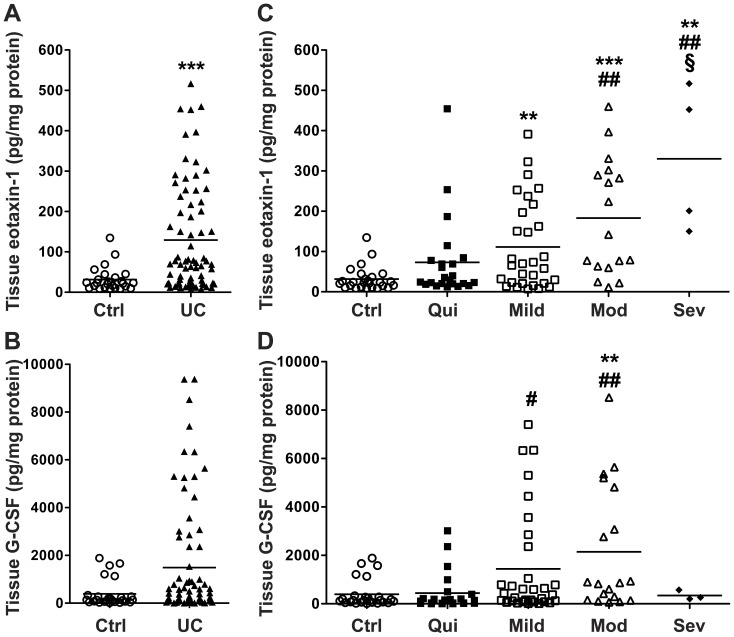
Figure 2. Colon tissue eotaxin-1 is significantly increased in UC.
Snap frozen colonic biopsies were lysed and cytokine/chemokine levels were measured by Luminex technology, with each sample corrected for tissue lysate protein concentration, all as described in the Methods. (A) Eotaxin-1 and (B) G-CSF concentration in control and all UC patients. (C) Eotaxin-1 and (D) G-CSF concentration in UC tissues stratified by histologic disease severity, and in control subjects. n = 34 for control, and n = 86 for UC. **p<0.01; ***p<0.001 vs. control. # p<0.05; ## p<0.01 vs. quiescent colitis. §p<0.05 vs. mild colitis.

