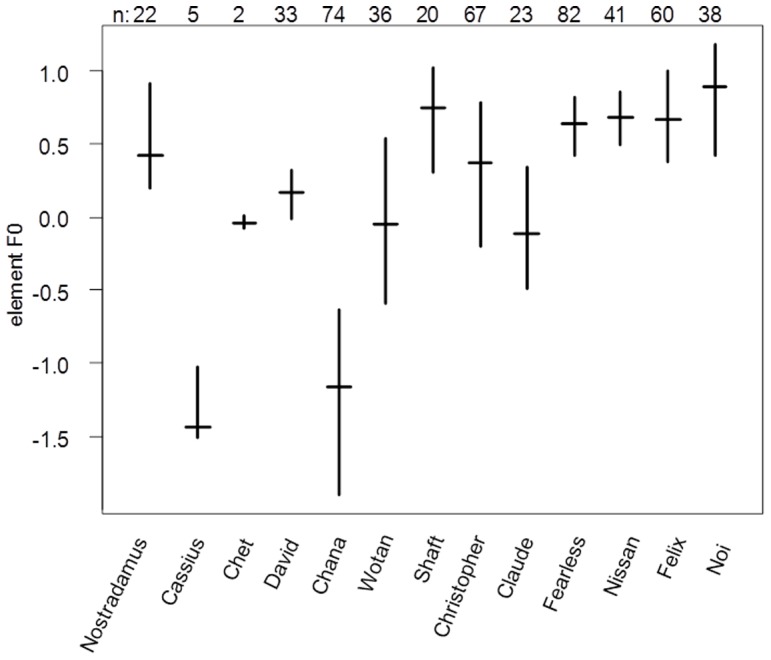
Figure 2. Individual differences expressed as factor score values representing elements' fundamental frequency (F0) of 13 adult male gibbons residing at Khao Yai National Park, Thailand.

Full names of gibbons recorded are reported at the x-axis as well as total number of calls used in the analysis on top of the graph. Males are represented in order of increasing mean androgen levels. Indicated are medians (horizontal lines) and quartiles (vertical lines).
