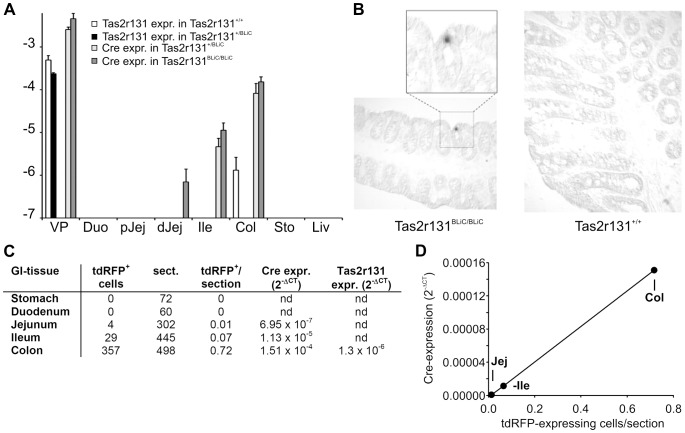
Figure 2. Cre recombinase expression in gastrointestinal tissues of gene-targeted mice.
(A) cDNA was prepared from vallate papillae (VP), duodenum (Duo), proximal (pJej) and distal (dJej)jejunum, ileum (Ile), colon (Col), stomach (Sto), and liver (Liv) of homozygous and heterozygous Tas2r131BLiC/BLiC as well as Tas2r131+/+ control mice. The cDNA samples were subjected to quantitative real-time PCR analyses using primers specific for Tas2r131 (white bars, amplification of cDNAs from Tas2r131+/+; black bars, amplification of cDNAs from Tas2r131+/BLiC; Tas2r131 expression in Tas2r131BLiC/BLiC was not detectable) and Cre-recombinase (dark gray bars, amplification of cDNAs from Tas2r131BLiC/BLiC; light gray bars, amplification of cDNAs from Tas2r131+/BLiC; Cre expression in Tas2r131+/+ was not detectable). Y-axis = logarithm of the expression levels relative to β-actin (mean log(2−ΔCT) ±SE, n≥3). (B) In situ hybridization of colon cross-sections of homozygous Tas2r131BLiC/BLiC mice (left panel) and Tas2r131+/+ control mice (right panel). Note that cells expressing Cre-mRNA were only detected in colon sections of Tas2r131BLiC/BLiC mice, but not in the corresponding control tissue. (C) Comparison of the numbers of tdRFP expressing cells in sections of the stomach, duodenum, jejunum, ileum and colon with the expression levels determined by qRT-PCR analyses. The absolute numbers tdRFP expressing cells (tdRFP+ cells) and the numbers of sections (sect.) monitored for the various GI-tissues are provided and compared to the values obtained for Cre- and Tas2r131-mRNAs in the corresponding homozygous mouse lines by the qRT-PCR analyses shown in A. (D) Graph showing the correlation between Cre-mRNA expression levels and the number of tdRFP expressing cells per section in distal jejunum (Jej), ileum (Ile) and colon (Col).

