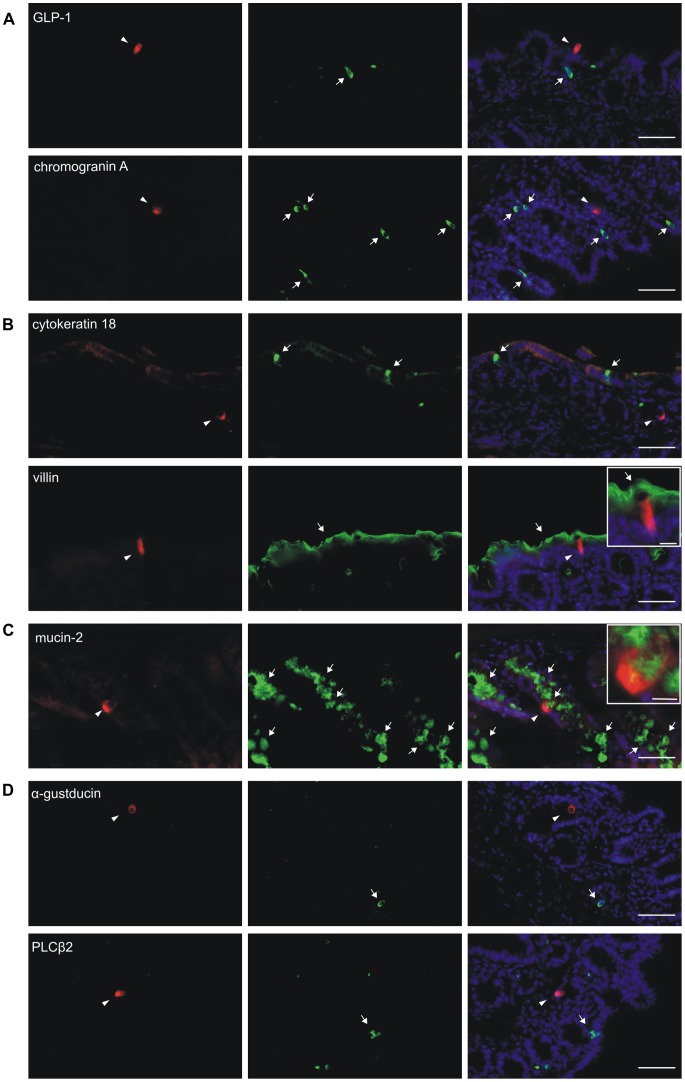
Figure 3. Characterization of tdRFP expressing cells in mouse large intestine.
Red tdRFP expressing cells are labeled by arrowheads (left row). Arrows point to cells expressing one of the various marker proteins (green) used in this experiment (middle row). An overlay of the red and green fluorescence is shown in the right row. (A) Labeling of tissue sections with markers of enteroendocrine cells, GLP-1 (upper panel) and chromogranin A (lower panel). (B) Labeling of tissue sections with markers for brush cells and brush border membranes, cytokeratin 18 (upper panel) and villin (lower panel), respectively. (C) Labeling of sections with goblet-cell marker mucin-2. (D) Labeling of tissue sections with markers of taste-like cells, α-gustducin (upper panel) and PLCβ2 (lower panel). Scale bars, 50 µm; 10 µm (insets).

