
Figure 1. HE staining of the lung tissues.
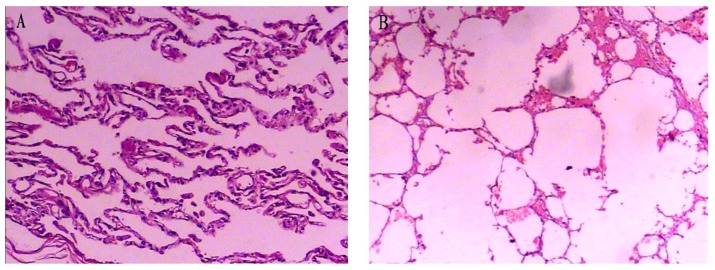
The photomicrographs of lung tissue from the non-COPD group (panel A) and the COPD group (panel B) (magnification: 100×). The mean linear intercept (MLI) and the destructive index (DI) in the COPD group were significantly higher as compared to the non-COPD group (P<0.001).