
Figure 2. HE staining of the pulmonary vasculature.
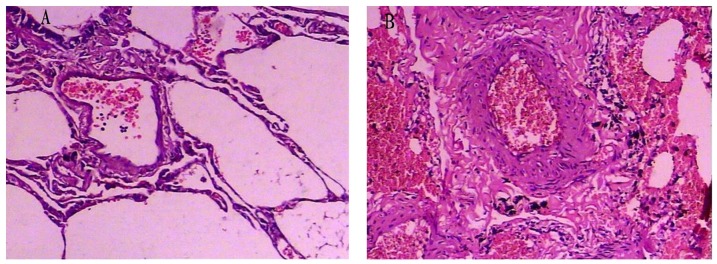
The photomicrographs of pulmonary vessels from the non-COPD (panel A) and the COPD group (panel B) (magnification: 100×). The histological presentation of pulmonary vasculature between the COPD group and non-COPD group was different.