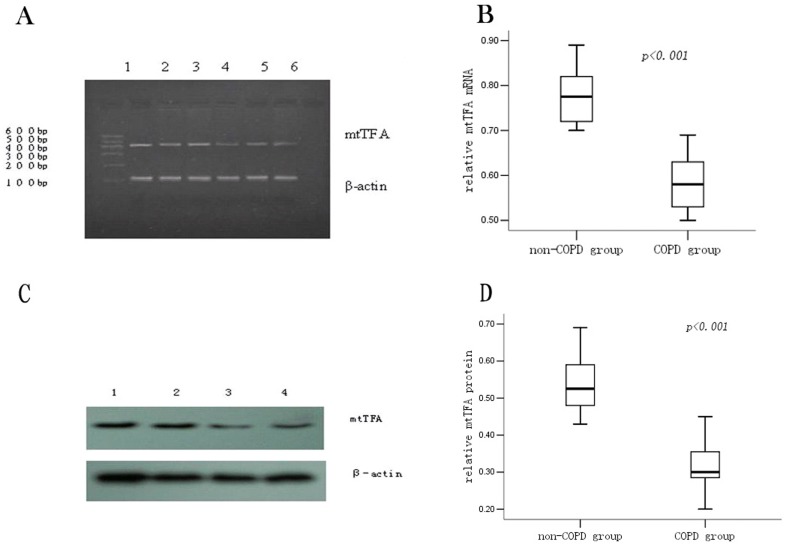
Figure 4. Expression of the mtTFA mRNA and protein in the lung tissue.
Expression of the pulmonary mtTFA mRNA measured by RT-PCR (panel A). Line 1, 2 and 3 were the non-COPD patients and line 4, 5 and 6 were the COPD patients. The level of mtTFA mRNA in lung tissues from the COPD group was lower as compared to the non-COPD group. Expression of the pulmonary mtTFA mRNA measured by qRT-PCR (panel B). Box plots display the range and distribution of the data with the upper, lower quartiles, and the median of the maximum difference of mtTFA mRNA in the non-COPD group and the COPD group. The median for each dataset is also indicated by the centerline. Expression of mtTFA protein (panel C): Line 1 and 2 were the non-COPD patients and line 4 and 5 were the COPD patients. The quantitative analysis of the protein density is also shown (panel D).

