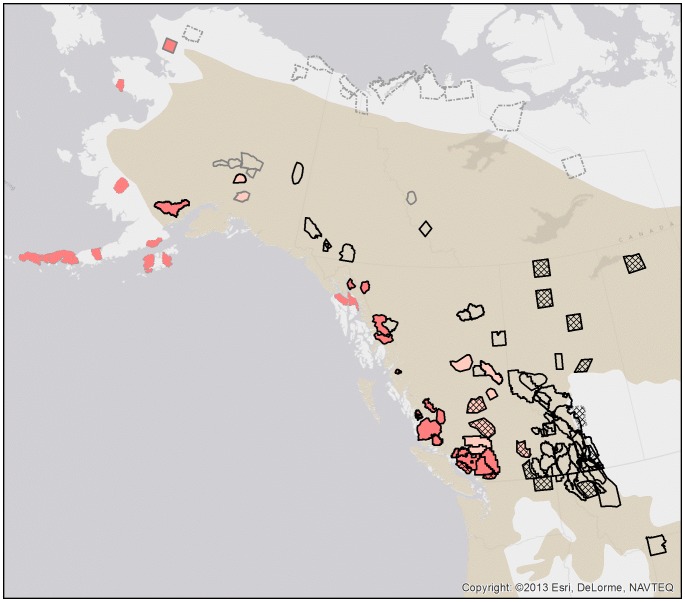
Figure 1. Estimates of grizzly bear density in North America.
Areas currently unoccupied are filled with hatching. The presence of black bears throughout the study area is denoted by a black outline, partial presence of black bears by a gray outline and a hatched gray or no outline means black bears did not occur on the study area. Areas without salmon are not colour filled, those with abundant salmon are filled in red, and those where salmon were present but not abundant in rose. The black bear distribution in North America is shown in tan [91].

