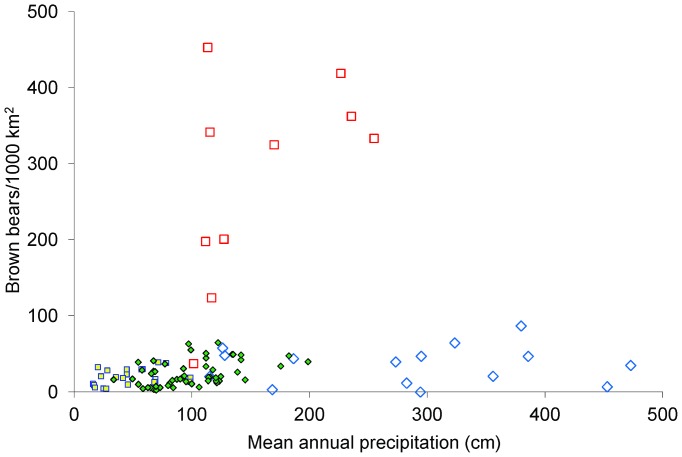
Figure 2. The relationship between grizzly bear density and mean annual precipitation.
Study areas where grizzly bears were allopatric are denoted by squares and where black and brown bears were sympatric by diamonds. Open symbols denote coastal study areas where salmon was a major component of the diet; filled symbols show study areas where salmon were few. Unoccupied areas and one coastal area where brown bears were allopatric and at very high density (856) are not shown.

