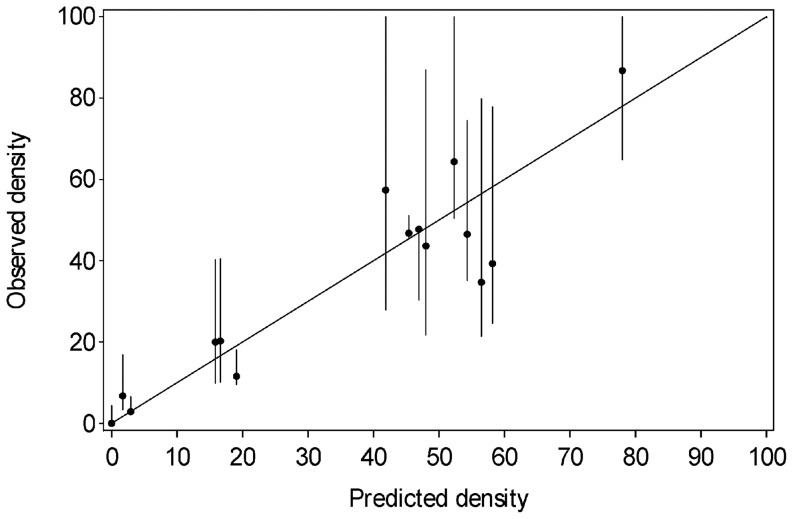
Figure 5. Observed versus predicted values of grizzly bear density (bears/1000 km2) using the best fit coastal model described in Table 5.
Data included 15 inventoried study areas and 2 unoccupied areas across the interior of western North America. Error bars are 95% confidence limits for observed data derived from the survey results or, estimated subjectively based on survey methods (see Methods for detailed description).

