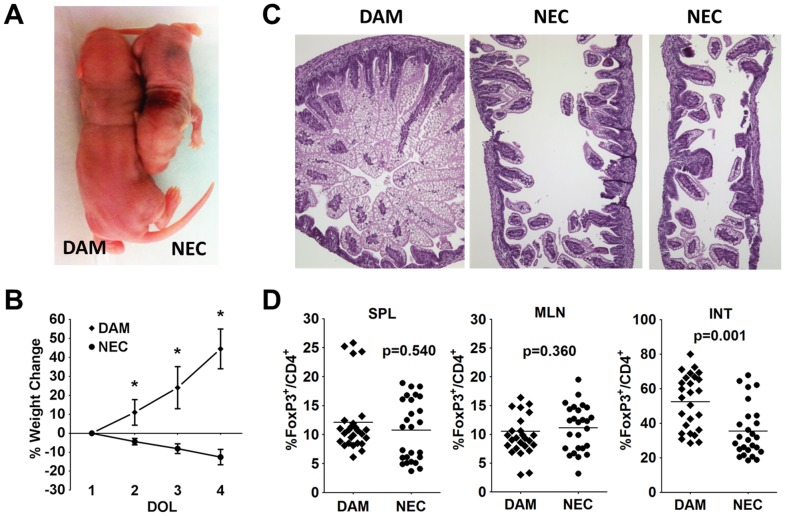
Figure 1. Frequency of Tregs in experimental necrotizing enterocolitis.
(A) Representative gross size difference between DAM (left) and NEC (right) rat pups at DOL 4. (B) Weight change for DAM vs. NEC pups for the 3 day experimental time period. Asterisks indicate p<0.001. (C) Representative H&E staining of terminal ileums from DAM and NEC. (D) Percentages of FoxP3+ Tregs within CD4+ T cells between DAM and NEC within the spleens (SPL), mesenteric lymph nodes (MLN) and terminal ileums (INT). Data are combined 3 independent experiments with n = 26 for each group.

