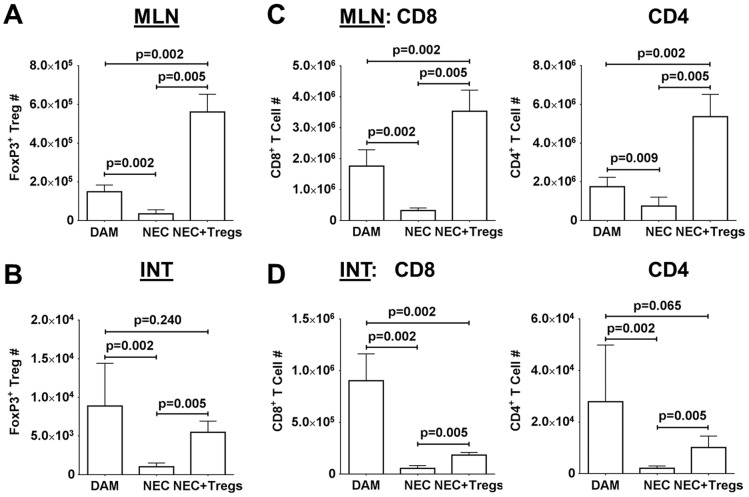
Figure 4. Cellularity after Treg adoptive immunotherapy.
Quantitative Treg cell counts within the (A) MLN and (B) INT among the DAM and surviving pups in the NEC and NEC+Tregs groups. Quantitative numbers of CD8+ and CD4+ T cells within the (C) MLN and (D) terminal ileums. Data are combined three independent experiments with DAM = 26, NEC = 20 and NEC+Tregs = 23.

