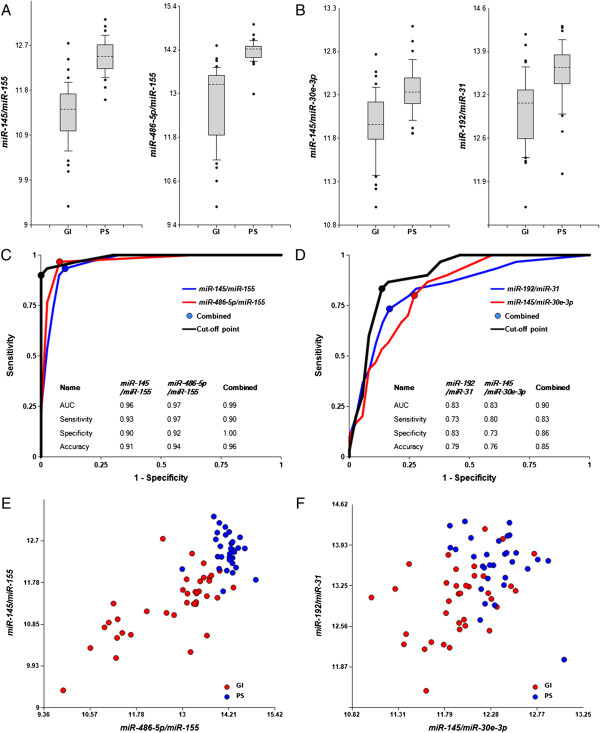
Figure 3.
Differentiation of GI pathologies fromPS pathologies by miRNA biomarker pairs. The concentrations of miRNAs in plasma samples from patients with GI pathologies (40 patients total) and pulmonary system pathologies (30 patients total) were measured by RT-qPCR and the ratios of various miRNAs were calculated as 2-ΔCq x100. A, B – box-plots. C, D –ROC curves for differentiation between patients with the four GI and the three pulmonary system (PS) pathologies obtained with different biomarker pairs. All statistical analyses are performed as in Figure 1. E, F – 2D-graphs comparing biomarker miRNA pairs from A, C and B, D, respectively.

