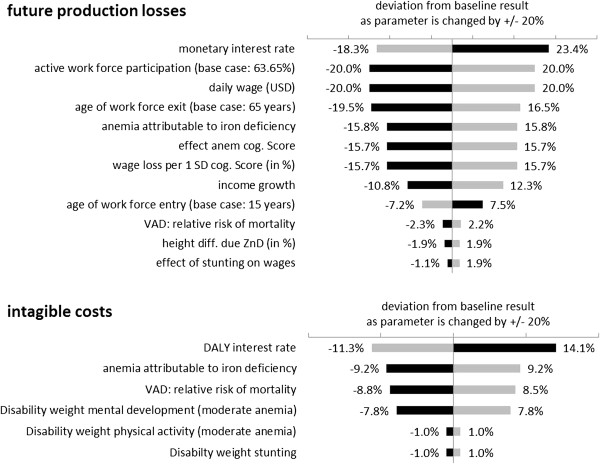
Figure 7.

Factors with strongest influence on intangible costs and future production losses. Grey bars indicate the consequence of an increase of the parameter by 20%; black bars the effect of a decrease of 20%.

Factors with strongest influence on intangible costs and future production losses. Grey bars indicate the consequence of an increase of the parameter by 20%; black bars the effect of a decrease of 20%.