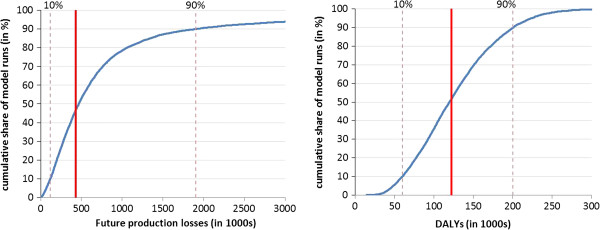
Figure 8.

Results of probabilistic SA for future production losses and intangible costs. The curves indicate the cumulative distribution of future production losses and intangible costs. The solid vertical line represents the main results of the model while the dotted vertical lines delimit the 80% confidence interval of the results of the probabilistic SA.
