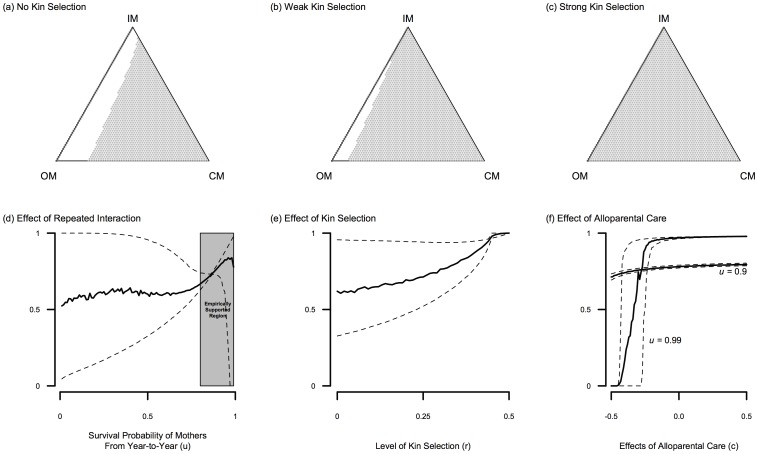
Figure 2. Model analysis illustrating the scope for cooperative mothers.
The upper row describes a deterministic process of the evolutionary dynamics of the three female strategies: Independent Mother (IM), Opportunistic Mother (OM), and Cooperative Mother (CM). The gray region is when selection favors CM, white region is when OM is favored, and the thicker dark line is where the fitness of OMs and IMs are the same. Panels (a)–(c) assume parameter values  ,
,  ,
,  ,
,  ,
,  ,
,  ,
,  and
and  . However panel (a) assumes no kin selection (
 ) and panel (b) prescribes weak kin selection (
 ), and panel (c) specifies strong kin selection (
 ). The bottom row of panels describes the basin of attraction for Cooperative Mothers through stochastic simulation as a function of the repeated interaction parameter
  (panel (d)), level of kin selection (panel (e)), and the effect of alloparental care (panel (f)). The position of the unstable equilibrium between OM and CM females shown in the ternary plots above defines the basin of attraction. The dashed curves are 95% confidence bounds around the mean (solid line) computed by taking 1000 random uniform parameter values within the ranges reported in Table 1 for each value of
  ,
,  , and
, and  on the horizontal axis for panels (d)–(f), respectively.

