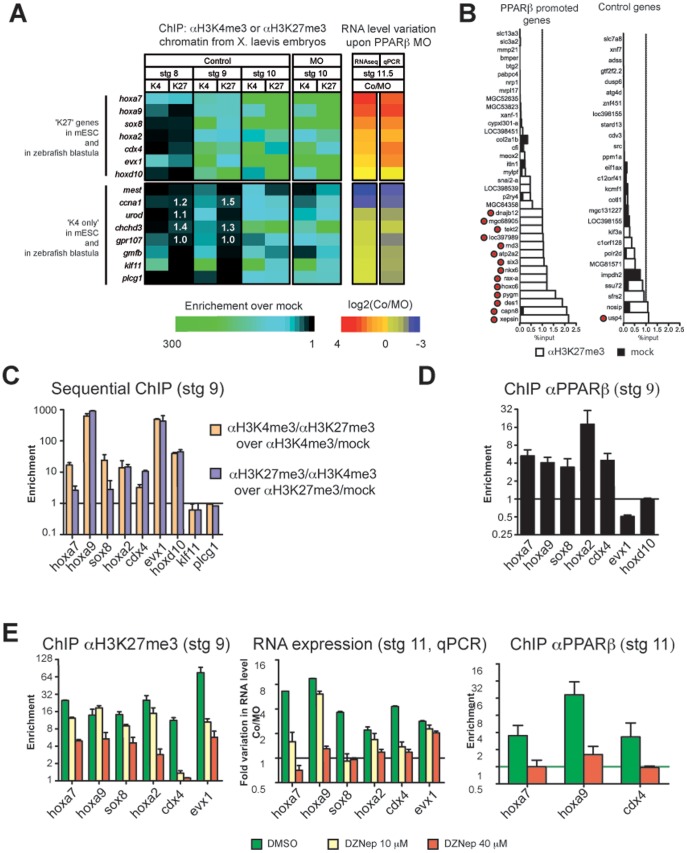
Figure 5. PPARβ interprets a chromatin signature that is deposited at the end of the pluripotent stage.
(A) Seven ‘K27’ genes and eight ‘K4 only’ genes were analysed by ChIP as indicated. Results are presented in a heat map (see also Supplementary Fig. 7). Variation in RNA expression upon PPARβ MO injection was obtained from the RNA-seq data or from qPCR validations. (B) ChIP with H3K27me3 antibody was conducted at stage 9 on 37 ‘PPARβ promoted genes’ and on 27 Control genes. PPARβ promoted genes were chosen among the top 200 most downregulated genes at stage 11, upon MO injection in the list presented in Table S1, while Control genes did not show a change of expression upon MO injection. Results are presented as percentage of input. The threshold of 1% is indicated. Genes scored as positive for H3K27me3 are indicated by a red dot (see methods for further details on the definition of gene sets and on the criteria of scoring). (C) Sequential ChIPs were conducted. Note that no enrichment was observed for klf11 and for plcg1, which represent negative controls (see panel b). Error is the S.E.M of 2 independent experiments. (D) ChIP using PPARβ antibody was conducted at stage 11.5. Error is the S.E.M of 3 to 4 independent experiments. (E) ChIP with H3K27me3 antibody or PPARβ antibody and qRT-PCR were conducted on embryos treated with DZNep or DMSO and injected with PPARβ MO or Co. Error is the S.E.M of technical replicates of a single experiment that we have replicated with similar results.

