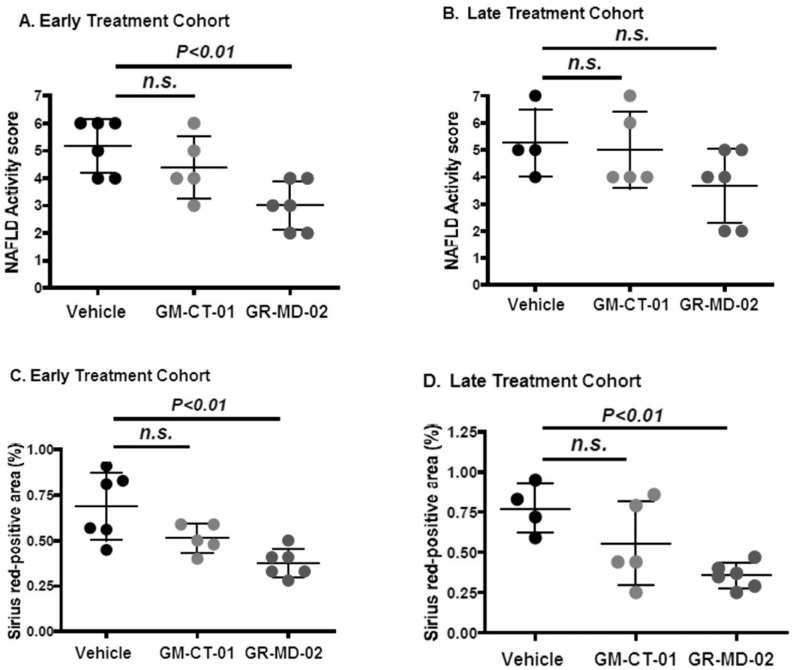
Figure 2. Quantification of NAFLD Activity Score (NAS) and collagen area.
Figure 2A and 2B show NAFLD Activity Score for groups administered twice weekly intravenous injections of vehicle (0.9% NaCl), GM-CT-01 (120 mg/kg), or GR-MD-02 (60 mg/kg) for the early and late treatment cohorts, respectively. Figure 2C and 2D show percent Sirius red positive area for groups administered twice weekly intravenous injections of vehicle (0.9% NaCl), GM-CT-01 (120 mg/kg), or GR-MD-02 (60 mg/kg) for the early and late treatment cohorts, respectively. Differences between the vehicle group and the treatment groups were assessed by one way ANOVA followed by Bonferroni Multiple Comparison Test. P values <0.05 were considered significant and results expressed as mean ± SD.

