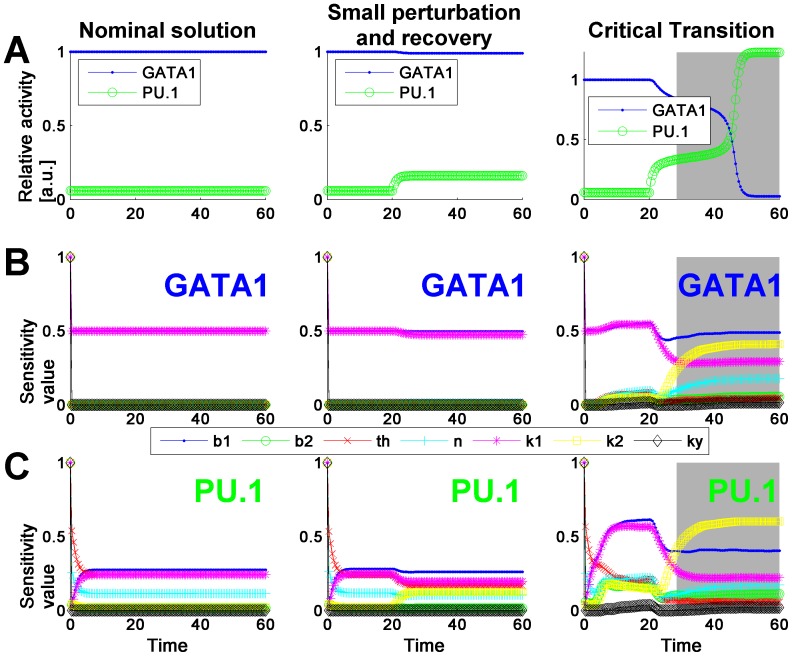
Figure 2. Dynamics of the model states and the sensitivity indices of the modified GATA1-PU.1 gene regulatory circuit model with added parameter ky.
The states dynamics is shown on line A; the sensitivity dynamics for GATA1 gene is shown on line B and for PU.1 gene – on line C. The left panel corresponds to the simulation providing the steady-state solutions. Middle panel corresponds to the introduced perturbation (value of parameter ky was increased from 0 to 0.1 at time = 20) and shows system's recovery after the perturbation. Plots of right panel show system's critical transition after significant perturbation of the parameter ky (value increased to 0.229) introduced at time = 20. Time is given in an arbitrary unit. The grey region of the right panel provides the early warning of system's critical transition, because the observed transition (A, right panel) occurs at time ≈47 and the grey region begins at time ≈27.

