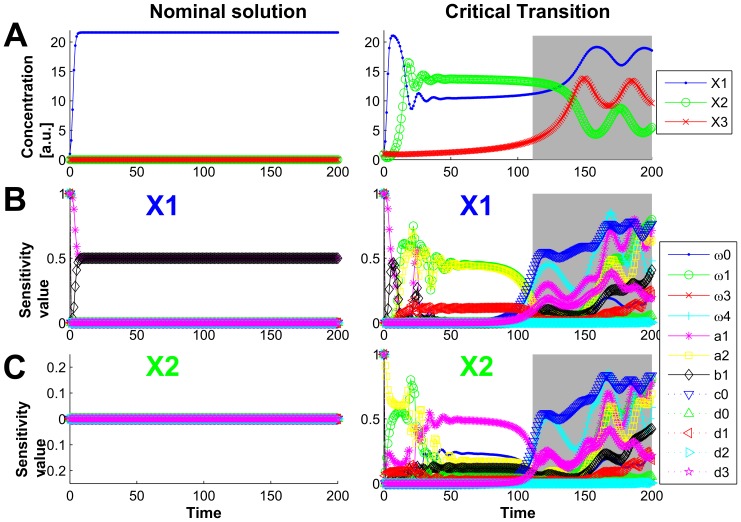
Figure 3. Dynamics of the model states and the sensitivity indices of the three-species food chain model.
The states dynamics is shown on line A; the sensitivity dynamics for species X1 is shown on line B and for species X2 – on line C. The left panel corresponds to the simulation with values of initial conditions and the bifurcation parameter a1 providing the steady-state solutions (a1 = 1.297, c0 = 0.029, IC = (1, 0, 0)). The right panel shows the dynamics of the state and sensitivity values for the bistable case (a1 = 1.4, c0 = 0.036, IC = (1, 1, 1)). Time is given in an arbitrary unit. Grey regions on plots of right panel provide the early warnings of system's critical transition: transition occurs at time ≈140, but the sensitivities for both model states change at time ≈110 (beginning of the grey region).

