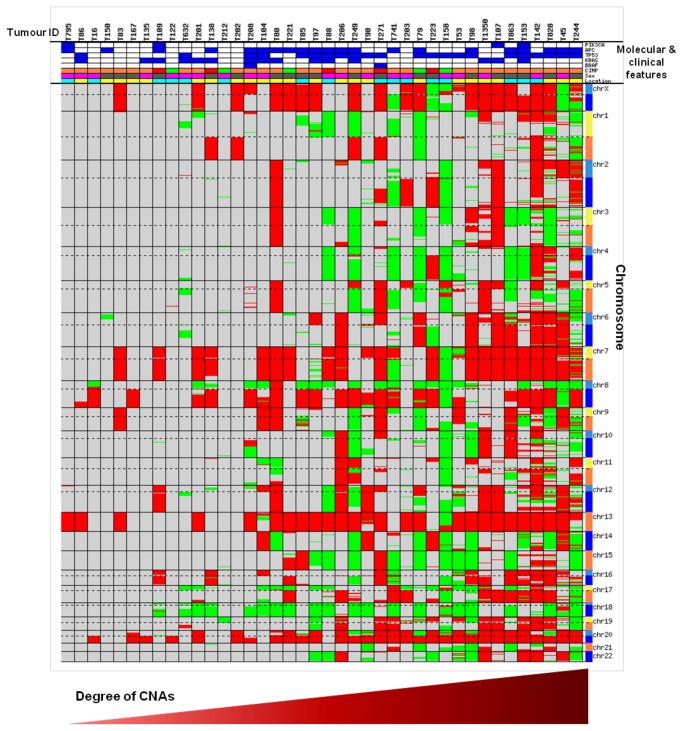
Figure 2. CNA identified in 40 CIN tumour samples (180K format array).
Representation of all the CNA identified in 40 chromosomally unstable cases analysed using the 180K platform. Red represents gain and green represents deletion. Dotted lines mark centromeres. Molecular and clinical features in order from top; PIK3CA, APC, TP53, KRAS and BRAF mutation status (blue and white represents mutant and WT respectively), CIMP (red, orange and green represent CIMP-H, CIMP-L and CIMP-N respectively), patient’s gender (pink and grey represent female and male respectively) and tumour location (yellow and cyan represent proximal and distal respectively).

