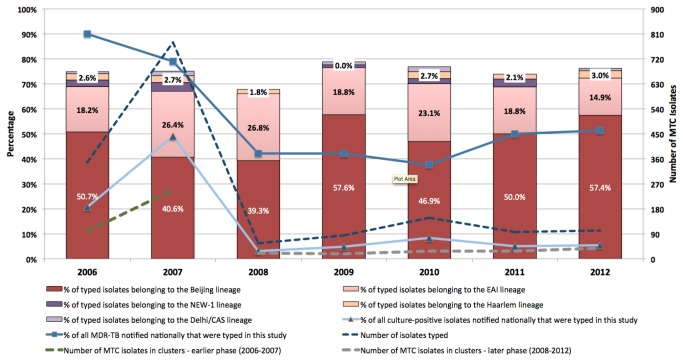
Figure 1. Distribution of MTC isolates typed each year, including the number of isolates clustered via combined spoligotyping and MIRU-VNTR, and the proportion of major tuberculosis lineages.
The percentages of all nationally notified culture-positive and multidrug-resistant MTC isolates typed each year are also shown.

