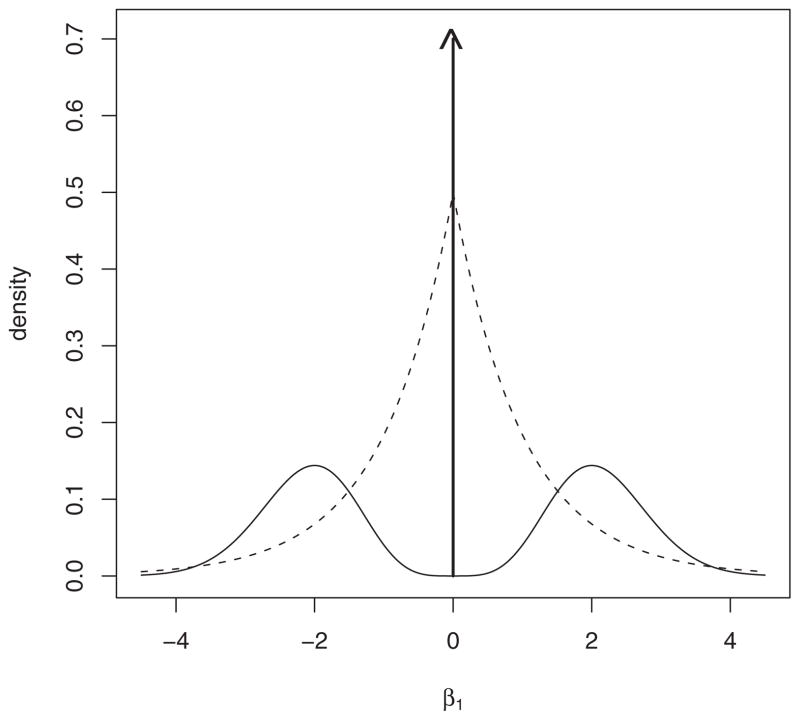
Figure 5.
Nonlocal prior density versus LASSO prior density. The density depicted by the solid line represents an equal mixture of a one-dimensional pMOM density and a point mass at 0. The density illustrated by the dashed line represents the double exponential prior density associated with the LASSO procedure.

