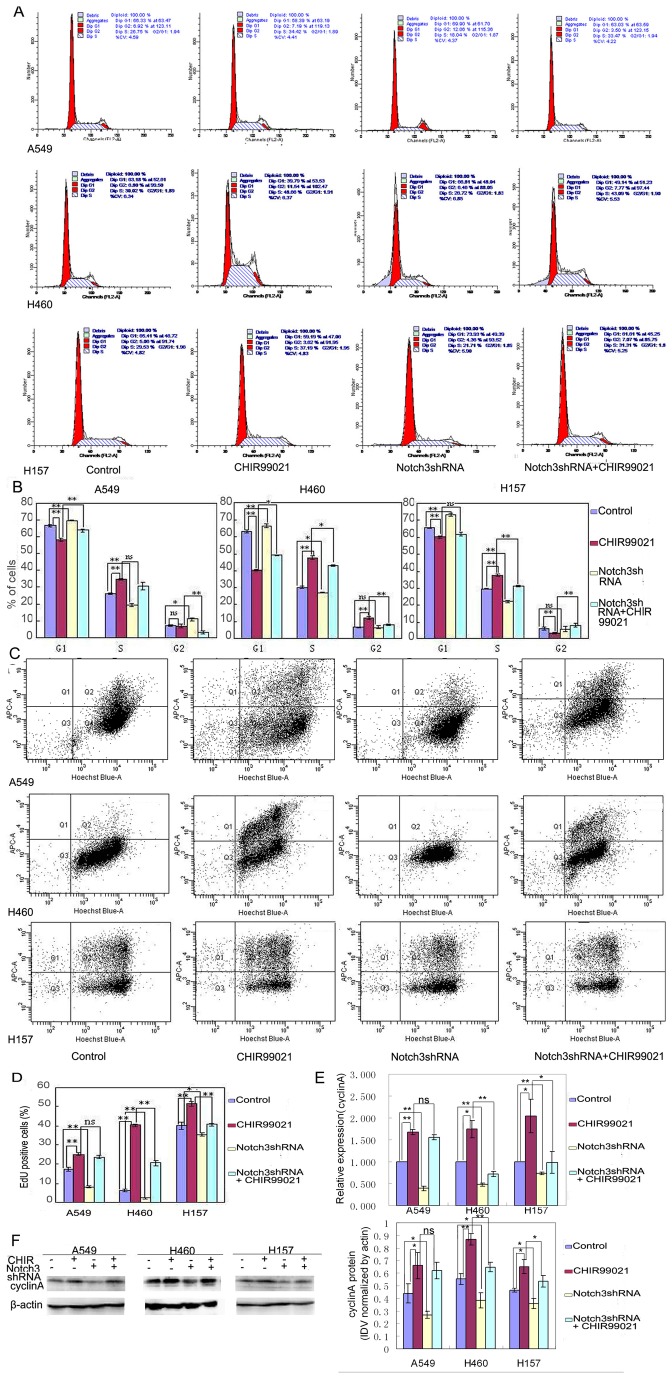
Figure 3. Notch3 was involved in the alteration of cell cycle and proliferation induced by CHIR99021 in H460 and H157.
(A) The distribution of cells in different cycle phases was analyzed by flow cytometric analysis with or without the reduction of Notch3 in presence or absence of CHIR99021. (B) Histograms represent the percentages of different cycle phases.(C) The cells incorporated with EdU were analyzed by flow cytometric analysis with or without the reduction of Notch3 in presence or absence of CHIR99021.The cells in Q2 are the EdU positive cells. (D) Histogram represents the percentages of EdU positive cells. (E) Real-time RT-PCR was performed to evaluate the expression of cyclinA. (F) Western blot panels represent the expression of cyclinA. The histogram of densitometric analysis is shown on right. Error bar represents mean ± s.d..

