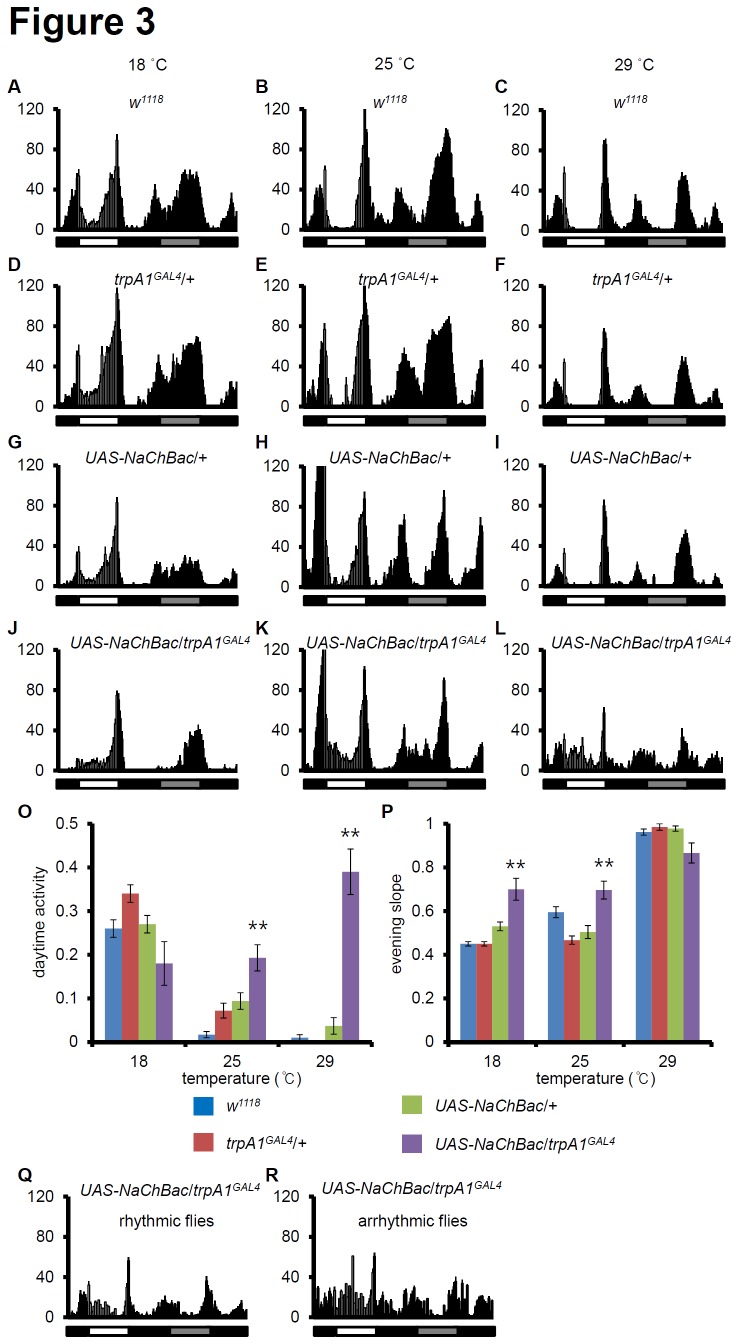
Figure 3. Activation of trpA1 neurons at different temperatures.
Averaged activity profiles during light/dark (LD3) and the first dark cycle (DD1) at 18°/25°/29°C are shown in the following genotypes: (A–C) w 1118, (D–F) trpA1 GAL4/+, (G–I) UAS-NaChBac/+, (J–L) UAS-NaChBac/trpA1 GAL4. Left, middle, and right panels show the locomotor activity at 18°C, 25°C, and 29°C, respectively. The white, black, and grey bars represent day, night, and subjective day, respectively. (O–P) The daytime activities (O) and the evening slope (P) were computed. For the statistical analysis, the data were analyzed using ANOVA and Scheffe’s post-hoc tests (** p-value < 0.01). The p-values are relative to wild-type. (Q-R) The locomotor activity of rhythmic (Q) and arrhythmic flies (R) at 29°C.

