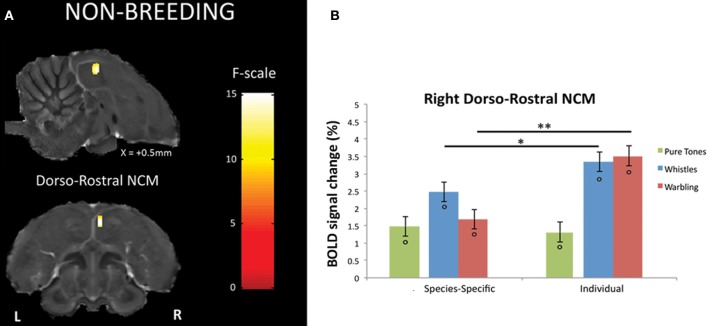
Figure 4.
Neural substrates for differential song processing during the non-breeding season. (A) Superimposition of the statistical results to anatomical sagittal and axial images coming from the high-resolution starling image. The position of the slice along the X (left/right) axis is indicated (the + sign indicates that results are from the right hemisphere). Results are of those voxels displaying a significant differential response between songs conveying species-specific and group information (SPEC) and songs conveying individual information (INDIV). F-values are color coded according to the scale displayed on the right side of the panel. (B) Estimates of the relative (vs. rest) response amplitude (±−SEM) of neural activations elicited by the different song stimuli in the cluster illustrated in (A) (the values have been extracted from the voxel with the maximum F-value). The zero level corresponds to the mean activation level during rest periods (exposure to scanner noise). Circles indicate statistically significant differences between stimuli vs. rest. Stars indicate statistical significance of comparison between species-specific song stimuli and individual song stimuli (*p < 0.05; **p < 0.001).

