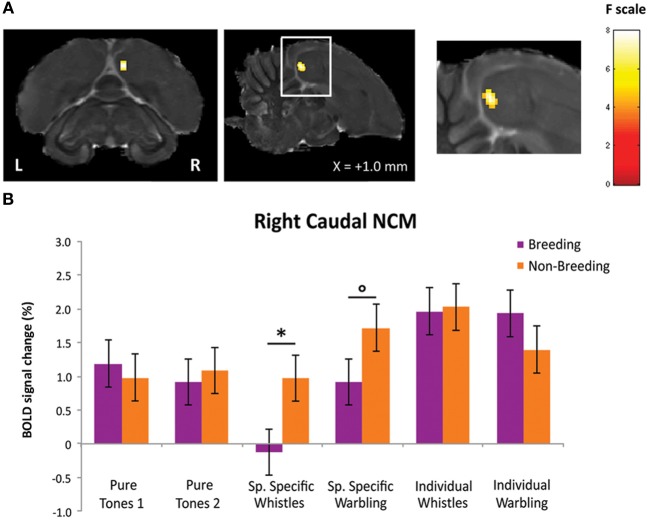
Figure 5.
Effect of season on differential song processing. (A) Statistical map of voxels displaying a significant difference in differential song processing between breeding and non-breeding season [(INDIV—PT) vs. (SPECT—PT)]breeding vs. [(INDIV—PT) vs. (SPECT—PT)]non-breeding (F-test from a repeated measures ANOVA; N = 5). F-values are color coded according to the scale displayed on the right. The position of the slice along the X (left/right) axis is indicated (the + sign indicates that results are from the right hemisphere). (B) Estimates of the relative (vs. rest) response amplitude (+ SEM) of neural activations elicited by the different song stimuli in the cluster illustrated in (A) (values from the voxel with the maximum F-value). The zero level corresponds to the estimated mean activation during rest periods. The circle indicates that the difference between seasons shows a trend (°p < 0.1) and the star indicates statistically significant difference between seasons (*p < 0.05).

