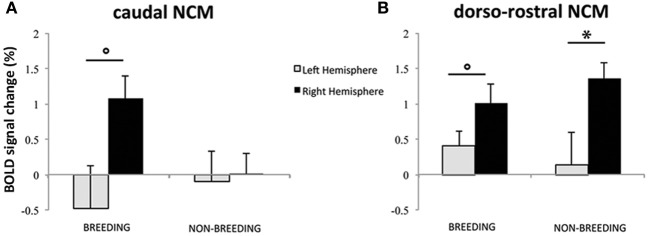
Figure 6.

Lateralization of differential song processing. (A) Estimates of the relative amplitude of differential song responses in left and right caudal NCM. (B) Estimates of the relative amplitude of differential song responses in left and right dorso-rostral NCM. Positive values indicate that the region was more activated by INDIV than by SPEC. Negative values indicate that the region was more activated by SPEC than by INDIV. The error bars correspond to SEMs across subjects. Circles indicate that the difference between left and right NCM clusters shows a trend (p < 0.1); stars indicate that the difference between left and right NCM clusters is significant (p < 0.05).
